

Mountain Province CPI Went up in August 2023
The Consumer Price Index for all items in Mountain Province for the month of August 2023 was estimated at 124.8 index points using 2018 as its base year. This means that using the year 2018=100, there was an increase of 24.3 index points on the average retail price of a fixed basket of goods and services commonly purchased by households in the province.
In addition, this was 0.6 index points higher compared to its preceding month with a CPI of 124.2 and was 3.4 index points higher compared to the same month of 2022 with 121.4 index points.
| Commodity Group | August 2022 | July 2022 | August 2022 |
|---|---|---|---|
| All Items | 121.4 | 124.2 | 124.8 |
| Food and Non-Alcoholic Beverages | 115.9 | 121.6 | 122.8 |
| Alcoholic Beverages and Tobaco | 165.5 | 172.9 | 172.7 |
| Clothing and Footwear | 118.2 | 117.0 | 116.9 |
| Housing, Water, Electricity, Gas and other Fuels | 131.8 | 132.9 | 131.5 |
| Furnishings, Household Equipment and Routine Maintenance | 124.9 | 127.9 | 127.4 |
| Health | 108.8 | 108.4 | 107.9 |
| Transport | 134.7 | 122.5 | 125.9 |
| Information and Communication | 99.8 | 100.0 | 100.0 |
| Recreation, Sport and Culture | 106.3 | 109.5 | 109.5 |
| Education Services | 104.8 | 101.8 | 107.3 |
| Restaurant and Accommodation Services | 152.55 | 158.4 | 158.4 |
| Financial Services | 100.0 | 100.0 | 100.0 |
| Personal Care, and Miscellaneous Goods and Services | 116.9 | 115.6 | 115.5 |
Commodity Group “Alcoholic Beverages and Tobacco” Tops the Index
Among the different major commodity groups in the province, Alcoholic Beverages and Tobacco had the highest value with a consumer price index of 172.7 for the
month of August 2023. Among its subgroups, tobacco continued to have the highest price index with 231.9 while other vegetable-based tobacco products had the price index of 159.2.
Figure 1: Consumer Price Index for All Income Households
Mountain Province: August 2023
(2018 = 100)
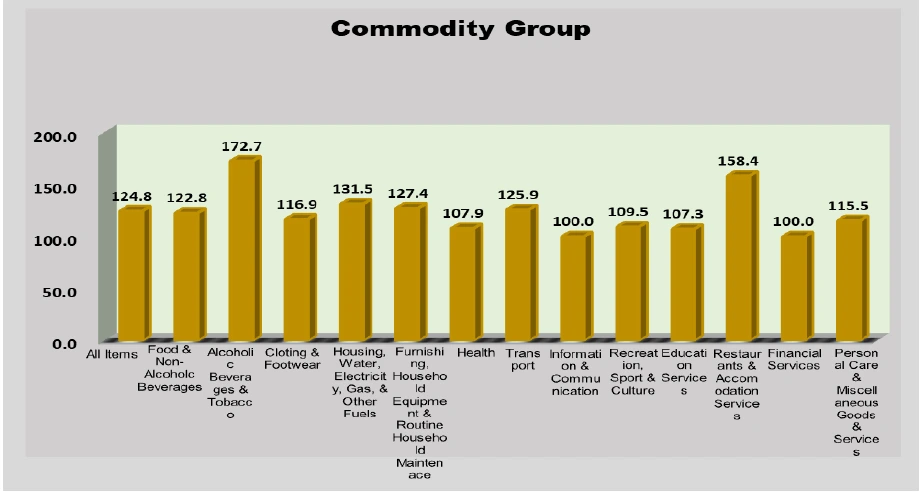
Restaurants and Accommodation Services ranked second with an index point of 158.4. Food and Beverage Serving Services had the highest index points with 163.7 among its subgroups followed by Accommodation Services with 137.8 index points.
Housing, water, electricity, gas, and other fuels ranked third with an index point of 131.5. Among its subgroups, electricity, gas, and other fuels had the highest index point of 138.7 followed by actual rentals for housing with an index point of 126.9.
Information and Communication together with Financial Services both had the lowest CPI in the province with the same index points of 100.0.
CPI for All Items Shows an Upward Trend
Figure 2 shows the CPI for All Items in the province for the months of July 2023 and August 2023. The indices for All Items showed an increase in August 2023 with an index point of 124.8 compared to July 2023 with an index point of 124.2.
Among the different commodity groups, Transport had the highest increase of 3.4 index points followed by Education Services with 2.5 index points, and Food and Non-alcoholic Beverages with 1.2 index points. Whereas, four commodity groups including Information and Communication; Recreation, Sports and Culture;
Restaurants and Accommodation Services had no changes in their indicex points that means their price indices remained the same in August 2023 compared to that of the previous month.
Figure 2: Consumer Price Index by Commodity Group
Mountain Province: July 2023 and August 2023
(2018 = 100)
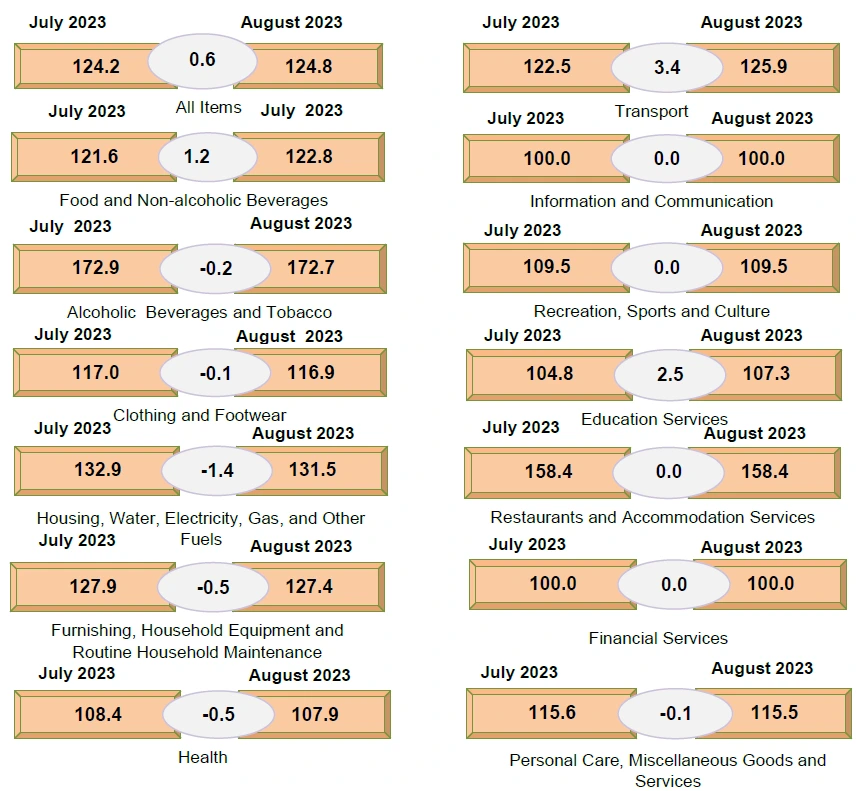
All other commodity groups yielded to negative index points including Alcoholic Beverages and Tobacco; Clothing and Footwear; Housing, Water, Electricity, Gas, and Other Fuels; Furnishing, Household Equipment and Routine Household Maintenance; and, Personal Care, Miscellaneous Goods and Services due to their decreased price indices.
Inflation Rate by Month
Inflation rate in the province decreased by 0.8 percent from July 2023 with 3.6% to 2.8% in August 2023. This is also 6.1% lower compared to that of the inflation rate of August 2022 which was 8.9%.
The downward movement in the inflation rate for August 2023 was due to the decrease in the inflation rates of most of the commodity groups. On the other hand, Food and Non-alcoholic Beverages had the highest share to this current month’s inflation trend contributing to 45.95%, followed by Housing, Water, Electricity, Gas and Other Fuels with 27.5% share, and Restaurants and Accommodation Services with 12.4% share.
Figure 3: Inflation Rate by Month,
Mountain Province: August 2022 – August 2023
(2018=100)
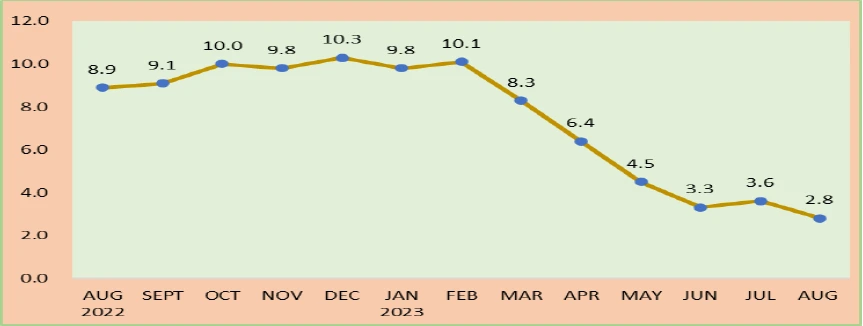
The following commodities contributed to the downward movement of the inflation rate for the said month:
a.Alcoholic beverages and tobacco, 3.5 percent;
b.Clothing and footwear, 3.1 percent and;
c.Personal care, and miscellaneous goods and services at 3.1 percent.
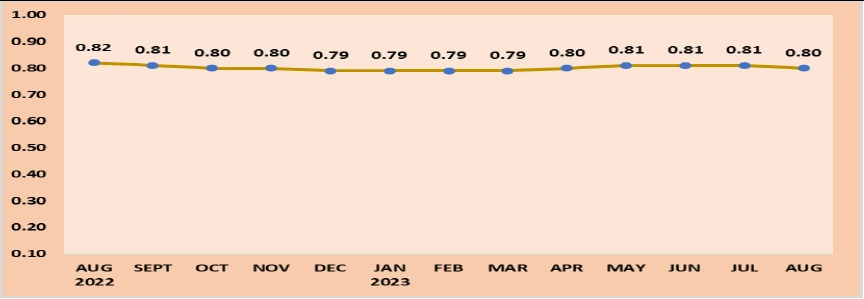
Purchasing Power of Peso (PPP) Slides by a Centavo
The Purchasing Power of the Peso (PPP) in the province for August 2023 went down to 0.80 from that of July 2023 with 0.81 PPP. This is also 2 centavos lower compared to the same month of the previous year (August 2022) with 0.82 PPP. Thus, a hundred peso in 2018 is worth 80 pesos this August 2023. (Figure 4).
Figure 4: Purchasing Power of Peso (PPP) by Month,
Mountain Province: August 2022 – August 2023
(2018=100)
TECHNICAL NOTES
Consumer Price Index (CPI) A single number used to measure changes in the average retail prices of a market basket or collection of goods and services commonly purchased by an average Filipino household. It shows how much on the average, prices of goods and services have increased or decreased from a particular reference period known as base year.
The CPI measures the changes in the price level of goods and services that most people buy for their day-to-day consumption relative to a base year (currently at year 2018)
It is widely used in the calculation of the inflation rate and purchasing power of the peso. Changes in the CPI over a specified period of time (usually a month or a year), is the rate of inflation. Inflation is equivalent to a decline in the purchasing power of peso (PPP).
The Purchasing Power of Peso (PPP) gives an indication of the real value of the peso (how much it is worth) in a given period relative to its value in a base period. Or it measures how much the peso in the reference year is worth in another year.
Inflation Rate (IR) is the rate of change in the average price level between two periods (year-on year/month-on-month as measured by the CPI).
Base Year (BY) is the reference point of the index number series, at which the index number is set to zero.
Market Basket (MB) is a sample of goods and services used to represent all goods and services produced or bought.
The monthly Consumers Price Index is computed based on the average retail prices of goods and services collected during the first week and mid-month of the reference month.
Retail Price - the actual price at which retailers sell a commodity on spot or earliest delivery, usually in small quantities for consumption and not for resale. It is confined to transactions on cash basis in the free market and excludes black-market prices and prices of commodities that are on sale as in summer sales, anniversary sales, Christmas sales, etc.

JERRY G. SANTOS
Chief Statistical Specialist
