

Table A: Year-on-Year Inflation Rates for All Items in CAR
In Percent
(2018=100)
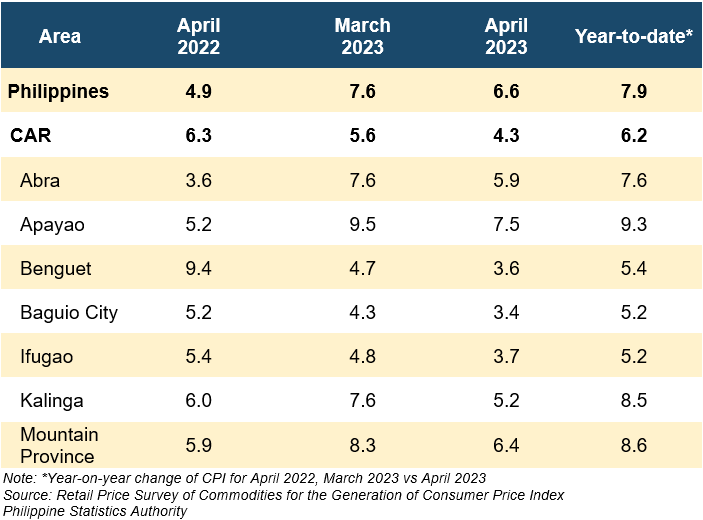
Figure 1: Inflation Rates in Cordillera Administrative Region, All Items:
April 2022 – April 2023 (2018=100)
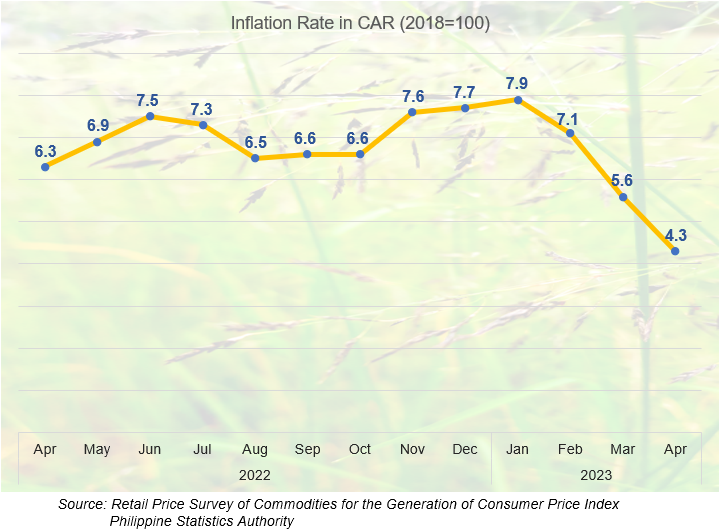
- Cordillera Administrative Region (CAR)
Inflation rate in Cordillera further eased to 4.3 percent in April 2023 from 5.6 percent in March 2023. Inflation in April 2022 was higher with 6.3 percent.
1.1 Main Drivers to the Downward Trend of Inflation in Cordillera
Among the 13 commodity groups, the further deceleration of inflation in April 2023 was primary brought about by the index of Housing, water, electricity, gas and other fuels with 0.4 percent, from 2.2 percent in March 2023. This was followed by the index of Food and non-alcoholic beverages with 7.2 percent, from 8.4 percent in the previous month. The third main driver of the inflation deceleration during the month was the index of Transport with 4.1 percent, from 8.4 percent in March 2023 (Table B and Figure 1).
Table B: Year-on-Year Inflation Rates for Commodity Group in CAR
In Percent (2018=100)
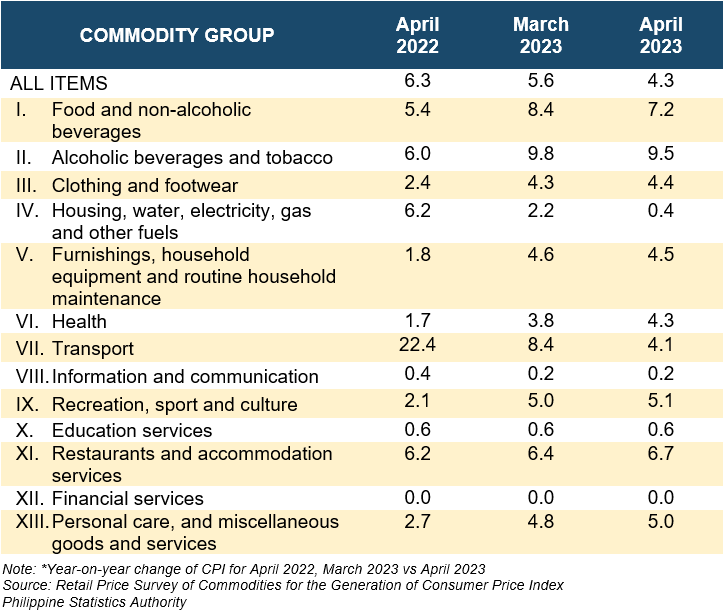
Lower inflation rates during the month were also noted in the indices of the following commodity groups:
a. Alcoholic beverages and tobacco,9.5 percent from 9.8 percent; and
b. Furnishings, household equipment and routine household maintenance, 4.5 percent from 4.6 percent.
In contrast, higher inflation rates were observed in the following commodity groups:
a. Clothing and footwear, 4.4 percent from 4.3 percent;
b. Health; 4.3 percent from 3.8 percent;
c. Recreation, sport and culture, 5.1 percent from 5.0 percent
d. Restaurants and accommodation services, 6.7 percent from 6.4 percent; and
e. Personal care, and miscellaneous goods and services, 5.0 percent from 4.8 percent.
Meanwhile, the indices of Information and communication and Education services retained their previous month’s increments with 0.2 percent and 0.6 percent, respectively. Similarly, the annual rate in the financial services index retained its annual rate of zero percent (Table B).
1.2 Main Contributors to Cordillera Inflation
In terms of contribution to the April 2023 inflation rate, the top three commodity groups were the following:
a. Food and non-alcoholic beverages with 60.3 percent share or 2.6 percentage points;
b. Transport with 9.2 percent share or 0.4 percentage points; and
c. Restaurants and accommodation services with 6.2 percent share or 0.3 percentage points.
- Food Inflation in CAR
Table C: Year-on-Year Inflation Rates for Food in CAR
In Percent (2018=100)
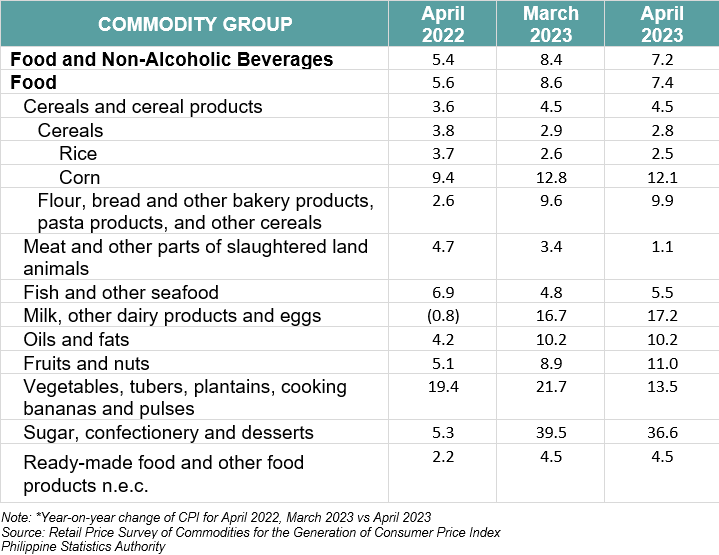
Food inflation in Cordillera continued to decelerate to 7.2 percent in April 2023 from 8.6 percent in March 2023. In April 2022, food inflation was lower with 5.6 percent (Table C).
2.1 Main Drivers of the Food Inflation Downward Trend
The primary driver of food inflation’s downward trend was the lower annual growth in the index of Vegetables, tubers, plantains, cooking bananas and pulses with 13.5 percent from 21.7 percent in March 2023. This was followed by Meat and other parts of slaughtered land animals with 1.1 percent from 3.4 percent, and Sugar, confectionery and desserts with 36.6 percent from 39.5 percent.
Lower inflation rates during the month were also noted in the indices of the following food items:
- Rice, 2.5 percent from 2.6 percent; and
- Corn, 12.1 percent from 12.8 percent.
On the other hand, a higher annual growth rate was registered in the following food groups:
- Flour, bread and other bakery products, pasta products, and other cereals, 9.9 percent from 9.6 percent;
- Fish and other seafood, 5.5 percent from 4.8 percent;
- Milk, other dairy products and eggs, 17.2 percent from 16.7 percent; and
- Fruits and nuts, 11.0 percent from 8.9 percent.
Meanwhile, Ready-made food and other food products not elsewhere classified retained its previous month’s rate, 4.5 percent.
- Provinces/ Highly Urbanized City (HUC) in CAR
All provinces and the city of Baguio in Cordillera registered a downtrend in Inflation. Kalinga registered the highest inflation deceleration in the region with 5.2 percent from 7.6 percent in March 2023, or 2.4 percentage points lower than the previous month. This was followed by Apayao with 7.5 percent, 2.0 percentage points lower than the 9.5 percent of the previous month. The third province that registered the highest deceleration was Mountain Province with 6.4 percent from 8.3 the previous month, 1.9 percentage points lower. The following are the rest of the provinces and the City of Baguio:
- Abra, 5.9 from 7.6 percent, 1.7 percentage points lower;
- Ifugao, 3.7 from 4.8 percent, 1.1 percentage points lower;
- Benguet, 3.6 percent from 4.7 percent 1.1 percentage points lower; and
- Baguio City, 3.4 percent from 4.3 percent 0.7 percentage points lower.
Apayao had the highest inflation rate in the region with 7.5 percent. This was followed by Mountain Province with 6.4 percent. The third with the highest inflation rate was the province of Abra with 5.9 percent. On the other hand, Baguio City with 3.4 percent inflation rate registered the lowest in the region.
(SGD)
VILLAFE P. ALIBUYOG
Regional Director
_______________________________________________
Note:
CPI and inflation rates by province and selected city are posted on the PSA website (http://openstat.psa.gov.ph).
