- Consumer Price Index (CPI) is the general measure of the change in the average retail prices of a market basket or collection of goods and services commonly purchased by the average Filipino household.
- Prices of goods and services in the region climbed steadily in 2019 except in June where it dipped a little by 0.1 index point. Comparing with 2018, prices rose more steeply until October and from then on declined and closed with a CPI of 117.1 in December.
Figure 1. Year-on-Year Consumer Price Index, All Items,
CAR: (January to December) 2018 and 2019 (2012=100)
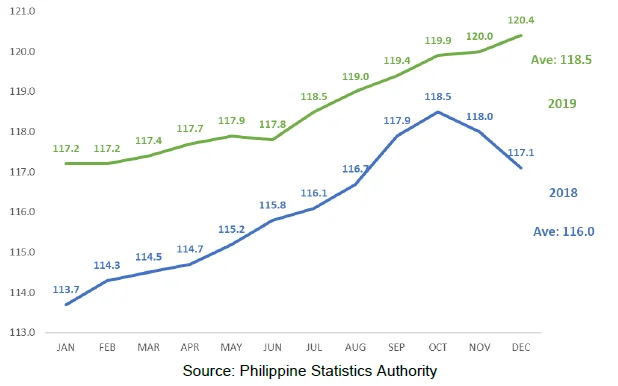
- The 2019 average CPI of the region was 118.5, 2.5 index points higher than the 2018 average CPI of 116.0.
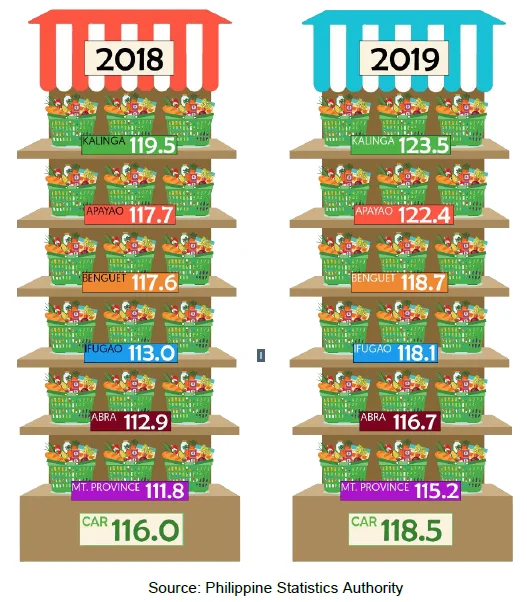
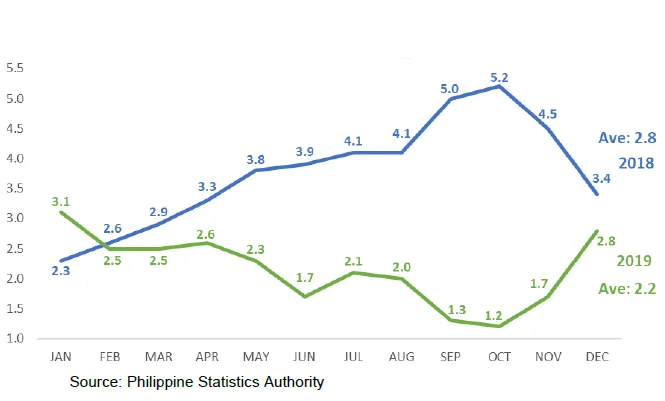
- Among the provinces of CAR, Kalinga posted the highest average CPI for 2018 with 119.5, followed by Apayao with 117.7, and Benguet with 117.6 while Mountain Province posted the lowest average CPI with 111.8.
- For the year 2019, among CAR provinces, Kalinga also posted the highest annual CPI with 123.5. This was higher by 4.0 index points from the previous year’s average CPI. Mountain Province continued to have the lowest average CPI with 115.2 (3.4 index points higher from 2018 average CPI).
Figure 2. Average Year-on-Year Consumer Price Index
by Province, CAR: 2018 and 2019 (2012=100)
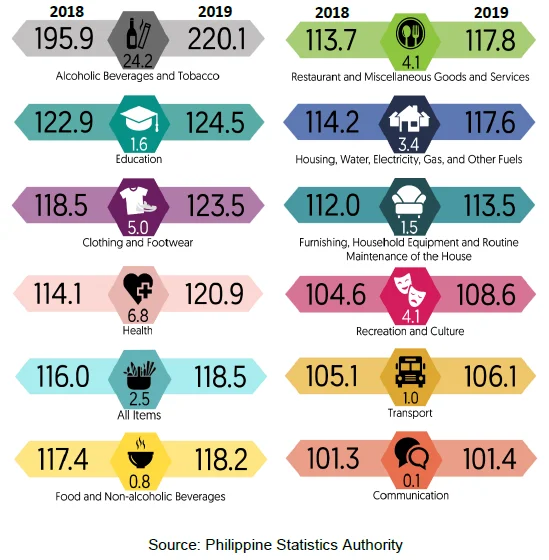
CPI by Commodity Groups
- Alcoholic Beverages and Tobacco had the highest annual CPI in the region among all the commodity groups in 2019 with 220.1. It increased by 24.2 index points from the average CPI of 195.9 in 2018.
- Education registered the second highest annual CPI among the commodity groups in the region for the year 2019 with 124.5, 1.6 index points higher from the average 122.9 in 2018.
- From an average 118.5 in 2018 to an average of 123.5 in 2019, Clothing and Footwear continued to rank third highest CPI in the region, which was 5 index points higher.
- Communication continued to have the lowest CPI among the commodity groups in the region with 101.4 index points average in 2019.
Figure 3. Average Year-on-Year Consumer Price Index
by Commodity Group, CAR: 2018 and 2019 (2012=100)
Inflation Rate
- The average increase in the prices of goods and services in the region slowed down to 2.2% in 2019 from the 2.8% average increase in 2018.
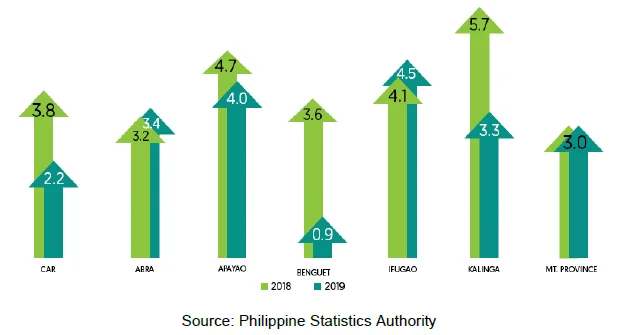
- Among all CAR provinces, Ifugao posted the highest average inflation rate in 2019 with 4.5%, followed by Apayao with 4.0%. Benguet incurred the lowest average inflation rate among all provinces with 0.9%.
Figure 4. Average Year-on-Year Inflation Rates, All Items,
CAR: (January to December) 2018 and 2019 (2012=100)
- All of the provinces had lower inflation rates in 2019 except for the province of Abra and Ifugao. Mountain Province maintained the same inflation rate for both 2018 and 2019.
Figure 5. Average Year-on-Year Inflation Rates by Province,
CAR: 2018 and 2019 (2012=100)
Inflation rate by Commodity Group
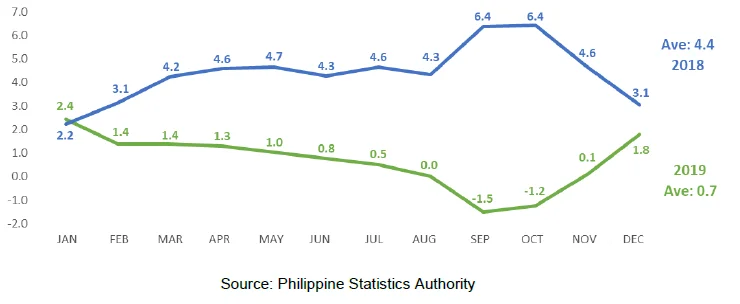
- Inflation rate of the heavily-weighted Food and Non-Alcoholic Beverages index in the region averaged to 4.4% 2018. From 2.4% inflation rate in January 2019 to 1.8 rate in December 2019 posted an average of 0.7%.
- Inflation rate of the heavily-weighted Food and Non-Alcoholic Beverages index in the region slowed down from the 2018 average rate of 4.4 to 0.7 rate in 2019.
Figure 6. Year-on-Year Inflation Rates of Food and Non-Alcoholic,
CAR: (January to December) 2018 and 2019 (2012=100)
CAR: (January to December) 2018 and 2019 (2012=100)
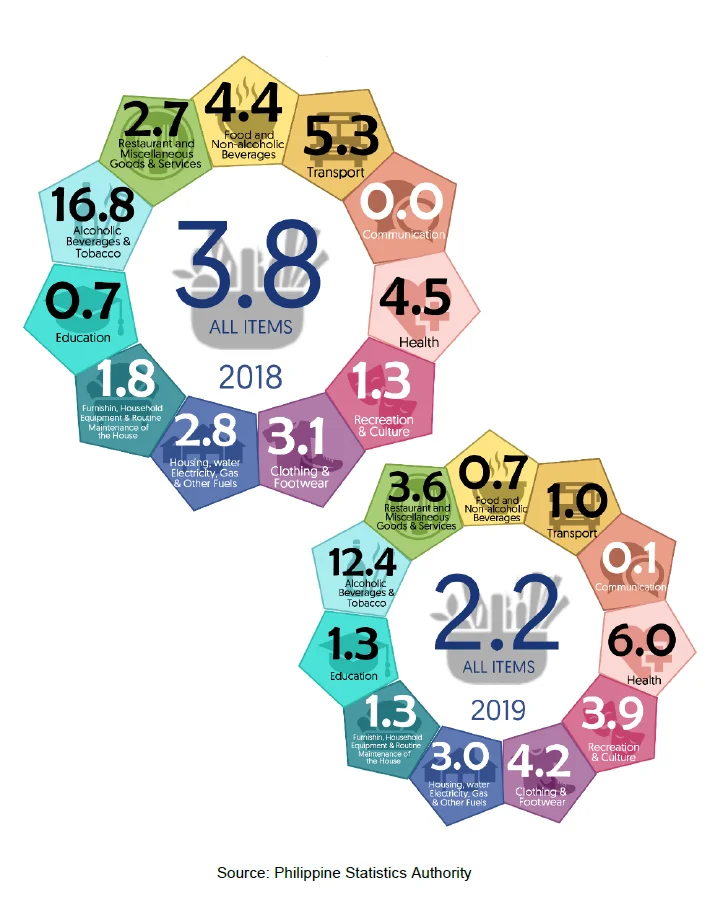
- Alcoholic Beverages and Tobacco remained to have the highest inflation for the year 2019 among other commodities in the region with an average of 12.4%. This slowed down by 4.4 index points from an average of 16.8% in 2018. Health, Clothing and Footwear, and Recreation and Culture followed with an average of 6.0% (increased from an average of 4.5% in 2018), 4.2% (increased from an average of 3.1% in 2018), and 3.9% (increased from an average of 1.3% in 2018), respectively.
- Among all other commodities, Communication incurred the lowest average inflation rate with 0.1% for 2019 and 0.0% for 2018.
Figure 7. Average Year-on-Year Inflation Rates by Commodity Groups,
CAR: 2018 and 2019 (2012=100)
CAR: 2018 and 2019 (2012=100)
CPI by Food Items
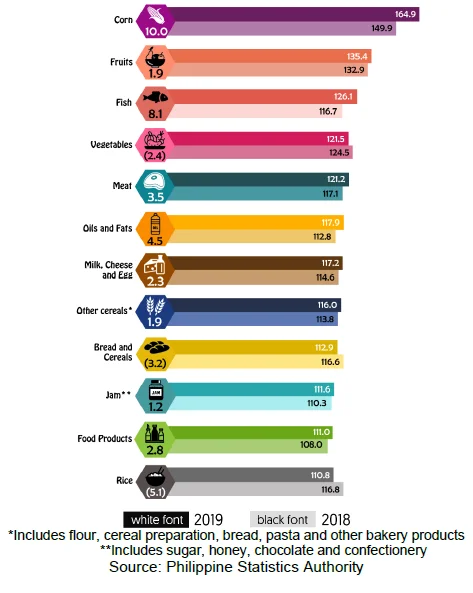
- For the year 2019, among all the food items, Corn recorded the highest average CPI in the region with 164.9. This was followed by Fruits, Fish, Vegetables, and Meat with 135.4, 126.1, 121.5, and 121.2 index points, respectively.
- Rice recorded the lowest average CPI in the region with 110.8 in 2019, followed by Food Products, Sugar, and Bread and Cereals at 111.0, 111.6, and 112.9, respectively.
- By index point change, Corn recorded the highest increase with 15.0 from an average of 149.9 in 2018 to an average of 164.9 in 2019. Fish followed with 9.5 index points increase from 116.7 average in 2018 to 126.1 average in 2019. Rice then averaged 116.8 in 2018 but decreased by 6.0 index points to 110.8 average in 2019. On the other hand, Jam recorded the lowest increase with 1.3 index points from 110.3 average in 2018 to 111.6 average in 2019, followed by Other Cereals and Fruits with an increase of 2.2 and 2.5 index points, respectively.
Figure 9. Average Year-on-Year CPI of Selected Food Items,
CAR: 2018 and 2019 (2012=100)
Purchasing Power of the Peso (PPP)
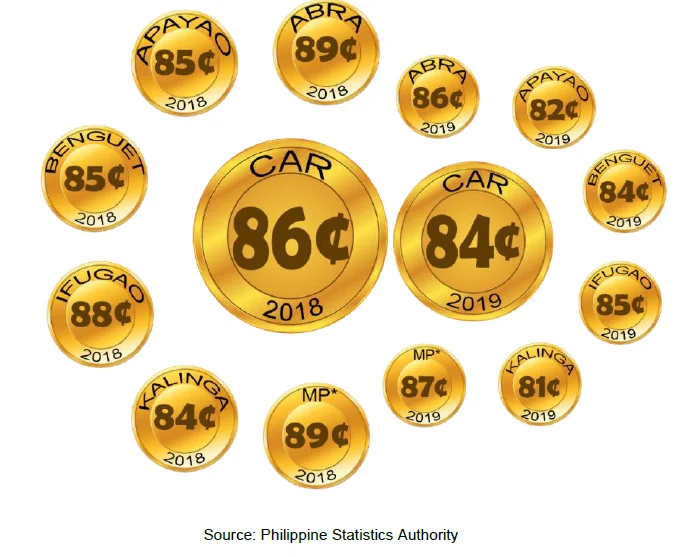
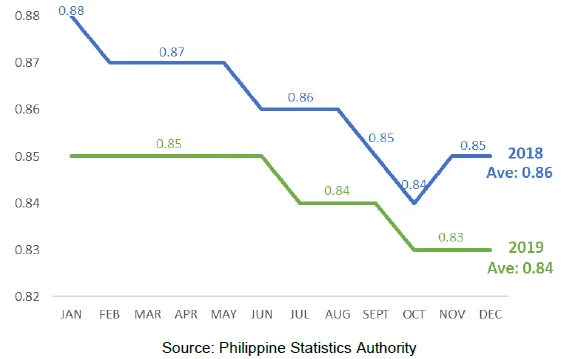
- The average value of peso in the region for the year 2018 was recorded at 86 centavos, from 88 centavos in January to 85 centavos in December. From 85 centavos in January to 84 centavos in December 2019, the value of peso in the region averaged 84 centavos. The value of peso dropped by two centavos, from 86 centavos average in 2018 to 84 centavos average in 2019.
- This means that one peso in 2012 is worth 84 centavos in 2019.
Figure 10. Year-on-Year Purchasing Power of the Peso,
CAR: (January to December) 2018 and 2019 (2012=100)
CAR: (January to December) 2018 and 2019 (2012=100)
- From another angle, a basket of goods that can be bought with 100 pesos in 2012 is worth 118.5 pesos in 2019.
- In general, the PPP in all provinces weakened in 2019 compared to the previous year’s PPP. Abra’s peso value in 2019 was recorded at an average of 86 centavos. It decreased three centavos from an average of 89 centavos in 2018. Apayao’s peso value decreased by three centavos from 85 centavos average in 2018 to 82 centavos average in 2019. From 85 centavos in 2018, Benguet’s peso value decreased by one centavo to 84 centavos average in 2019. Ifugao, Kalinga, and Mountain Province’s peso value also went down in 2019, from 88 centavos to 85 centavos, from 81 centavos to 84 centavos, and from 89 centavos to 87 centavos, respectively.
- Mountain Province had the highest peso value with 87 centavos average in 2019, followed by Abra with 86 centavos average. Meanwhile, Kalinga had the lowest peso value with 81 centavos average.
Figure 11. Average Year-on-Year Purchasing Power of the Peso by Province,
CAR: 2018 and 2019 (2012=100)
CAR: 2018 and 2019 (2012=100)