

Consumer Price Index
- Consumer Price Index (CPI) is the general measure of the change in the average retail prices of a market basket or collection of goods and services commonly purchased by the average Filipino household.
- The CPI of the Cordillera Administrative Region (CAR) in June 2019 was 117.8. This was higher by 2.0 index points from the 115.8 CPI of June 2018 using 2012 as base year.
- In general, the CPI increased reflecting the rise in the average prices of goods and services in all the six provinces of CAR.
Figure 1. Consumer Price Index by Province, CAR:
June 2019 (2012=100)
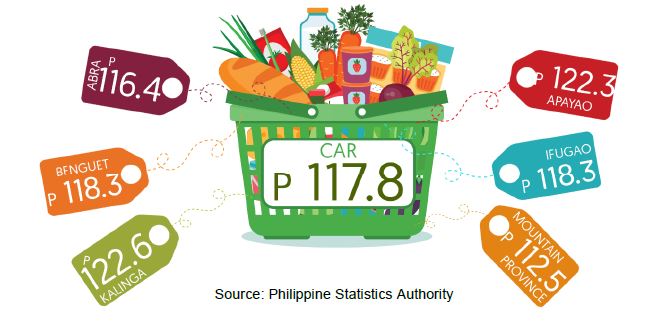
- Among the CAR provinces, Kalinga posted the highest CPI for June 2019 at 122.6, followed by Apayao at 122.3, and Benguet at 118.3 while Mountain Province posted the lowest CPI at 112.5.
CPI by Commodity Groups
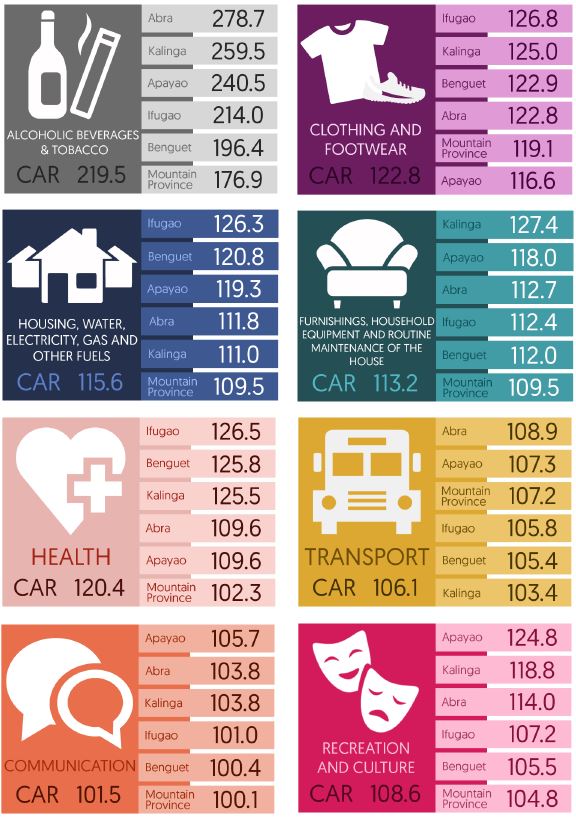
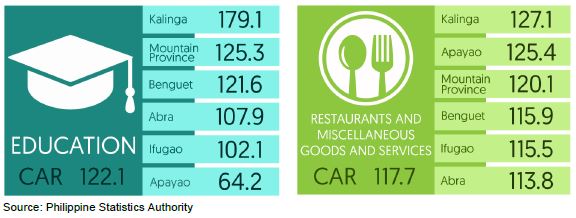
- Among the commodity groups, Alcoholic Beverages and Tobacco had the highest CPI in the region with 219.5. The province of Abra incurred the highest CPI on this commodity with 278.7, followed by Kalinga, Apayao, and Ifugao at 259.5, 240.5, and 214.0, respectively.
- Clothing and footwear registered the second highest CPI among the commodity groups in the region for June 2019 at 122.8 index points. Among the provinces, Ifugao had the highest index on clothing and footwear at 126.8, while Apayao had the least at 116.6.
- Education ranked third at 122.1 index points. Kalinga recorded the highest index on education at 179.1, followed by Mountain Province and Benguet at 125.3 and 121.6 index points, respectively.
- Communication continued to have the lowest CPI among the commodity groups in the region with 101.5 index points. The province of Apayao incurred the highest index on communication with 105.7 index points, while Mountain Province had the lowest with 100.1 index points.
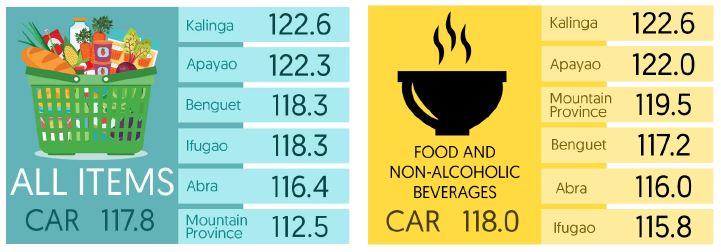
- Among the CAR provinces, Kalinga incurred the highest CPI for all items with 122.6, while Mountain Province garnered the least index at 112.5 in June 2019.
Figure 2. Consumer Price Index by Commodity Group and by Province,
CAR: June 2019 (2012=100)
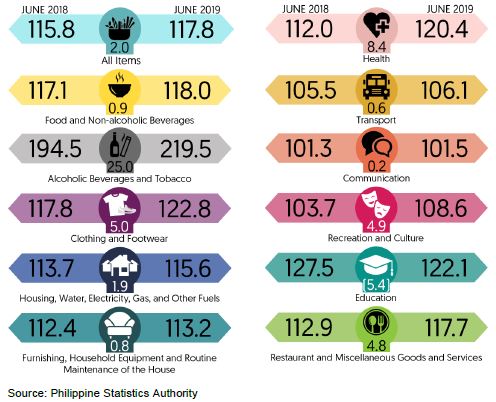
- By index point change, Alcoholic Beverages and Tobacco recorded the highest increase at 25.0. Increases were also incurred in Health (8.4 points), Clothing and Footwear (5.0 points), Recreation and Culture (4.9 points), and. The rest of the commodity groups reported minimal annual increases.
Figure 3. Year-on-Year Consumer Price Index by Commodity Group, CAR:
June 2018 and 2019 (2012=100)
Inflation Rate
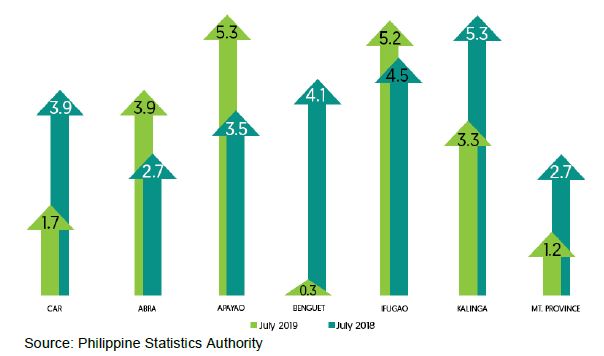
- The average increase in the prices of goods and services in the region slowed down to 1.7% in June 2019 from the 3.9 rate in June 2018.
- Apayao and Ifugao posted the highest inflation rate in June 2019 at 5.3% and 5.2%, respectively, followed by Abra at 3.9%, and Kalinga at 3.3%. Benguet incurred the least inflation among all provinces, with 0.3%.
- Inflation surpassed the June 2018 rate for the provinces of Abra, Apayao, and Ifugao while other provinces had lower inflation rates in June 2019 relative to the same month last year.
Figure 4. Year-on-Year Inflation Rates by Province, CAR:
June 2018 and 2019 (2012=100)
By Commodity Group
- Inflation rate of the heavily-weighted Food and Non-Alcoholic Beverages index in the region decreased from the May 2019 rate of 1.0 to the 1.7 of June 2019.
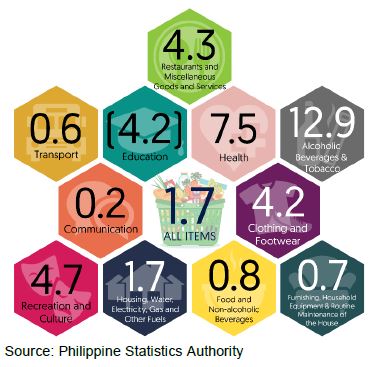
- Alcoholic Beverages and Tobacco remained to have the highest inflation in June 2019 among other commodities in the region with 12.9%, followed by Health and Recreation and Culture with 7.5% and 4.7%, respectively.
- Among all other commodities, only Education incurred a negative inflation rate of 4.2%.
Figure 5. Inflation Rates by Commodity Groups, CAR: June 2019
(2012=100)
By Food Items, Year-on-Year
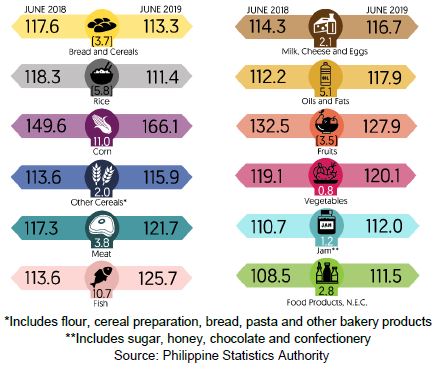
- Among the food items, Corn recorded the highest CPI in the region in June 2019 with 166.1. This was followed by Fruits, Fish, and Meat with 127.9, 125.7, and 121.7 index points, respectively.
- By index point change, Corn recorded the highest increase by 16.5. Fish followed with an 12.1 index point increase and Oils and Fats with 5.7.
Figure 6. Year-on-Year CPI and Inflation Rates of Selected Food Items, CAR:
June, Year 2018 and 2019 (2012=100)
Purchasing Power of the Peso (PPP)
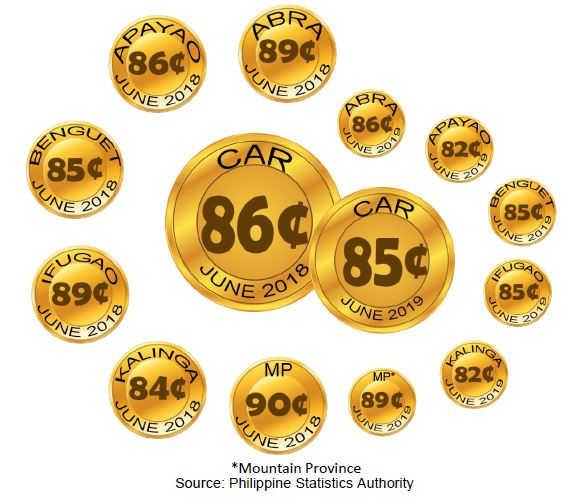
- The value of the peso in the region was 85 centavos in June 2019. It dropped by one centavo from 86 centavos in June 2018. This means that one peso in 2012 is worth 85 centavos in June 2019.
- In other words, a basket of goods that can be bought with 100 pesos in December 2012 is worth 117.8 pesos in June 2019
- The PPP in all the provinces generally weakened in June 2019 compared to the same month of the previous year.
- Mountain Province had the highest peso value at 89 centavos, followed by Abra with 85 centavo-peso value. Meanwhile, Apayao and Kalinga both had the lowest peso value at 82 centavos.
Figure 7. Purchasing Power of the Peso by Province, CAR:
May 2018 and 2019 (2012=100)
Technical Notes
Consumer Price Index (CPI) is a general measure of the change in the average retail prices of a market basket or collection of goods and services commonly purchased by the average Filipino household.
Inflation Rate (IR) is the rate of change in the average price level between two periods (year-on year/month-on-month as measured by the CPI)
Purchasing Power of the Peso (PPP) measures how much the peso in the reference year is worth in another year
Base Year (BY) is the reference point of the index number series, at which the index number is set to 100. It is the reference point of the index number series.
The CPI is now rebased to 2012 base year from the current 2006 base year. The year 2012 was chosen as the next base year because it was the latest year when the Family Income and Expenditure Survey (FIES) results were made available. It is also the synchronized rebasing of the price indices to base year 2006 and every six years thereafter.
Market Basket (MB) is a sample of goods and services used to represent all goods and services produced or bought.
