

Consumer Price Index
-
Consumer Price Index (CPI) is the general measure of the change in the average retail prices of a market basket or collection of goods and services commonly purchased by the average Filipino household.
-
The CPI of the Cordillera Administrative Region (CAR) in October 2018 was 118.5. This was higher by 5.9 index points from the 112.6 CPI of October 2017 using 2012 as baseyear.
-
Rebasing CPI is necessary to ensure that this barometer of economic phenomena is truly reflective of current situation. Consumer taste, fashion and technology change over time causing the fixed market basket of goods and services to become outmoded. To capture such changes for a more meaningful price comparison, revision or updating of the fixed market basket, sample outlets, weights, and base year had to be done periodically. The CPI is an indicator that derives its usefulness in its representation of how much a typical market basket behaves over a specific period.
Table 1. Consumer Price Index by Province, CAR:
October 2017 and 2018
(2012=100)
| Province | October | Index Point Change | |
|---|---|---|---|
| 2017 | 2018 | ||
| CAR | 112.6 | 118.5 | 5.9 |
| Abra | 110.4 | 115.8 | 5.4 |
| Apayao | 112.5 | 121.9 | 9.4 |
| Benguet | 114.5 | 119.5 | 5.0 |
| Ifugao | 109.7 | 116.2 | 6.5 |
| Kalinga | 113.6 | 123.6 | 10.0 |
| Mt. Province | 108.6 | 113.7 | 5.1 |
-
Among the CAR provinces, Kalinga posted the highest CPI for October 2018 with 123.6, followed by Apayao with 121.9, and Benguet with 119.5. Mountain Province posted the lowest CPI with 113.7.
-
In terms of index point change, Kalinga incurred the highest increase with 10.0 index points, followed by Apayao with 9.4 index points increase.
CPI by Commodity Groups
-
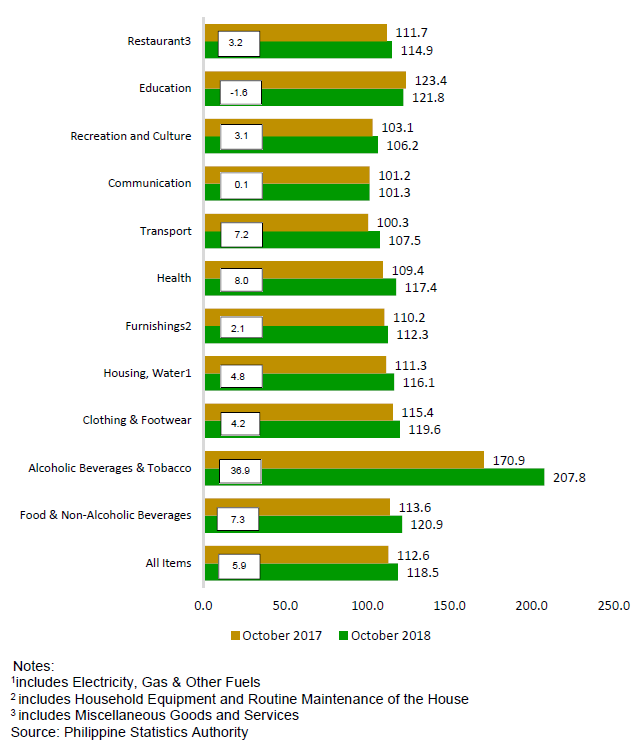
Among the commodity groups, Alcoholic Beverages and Tobacco had the highest CPI in the region with 207.8. The province of Apayao incurred the highest CPI on this commodity with 316.5, followed by Abra and Kalinga with 253.2, and 235.7, respectively.
-
Education registered the second highest CPI among the commodity groups in the region for October 2018 with 121.8 index points. Among the provinces, Kalinga posted the highest index on education with 179.1, distantly followed by Benguet and Mountain Province with 121.6 and 120.5, respectively. Apayao had the lowest with 60.9.
-
Food and Non-Alcoholic Beverages, the heavily-weighted commodity ranked third with 120.9 index points. Kalinga recorded the highest index with 125.8, followed by Apayao and Mt. Province, both with 122.3 index points, respectively.
-
Communication continued to have the lowest CPI among the commodity groups in the region with 101.3 index points. The province of Apayao incurred the highest index on communication with 104.2 index points, while Mountain Province had the lowest with 100.0 index points.
Table 2. Consumer Price Index by Commodity Group and by Province, CAR:
October 2018 (2012=100)
| Commodity Group | Region/Province | ||||||
|---|---|---|---|---|---|---|---|
| CAR | Abra | Apayao | Benguet | Ifugao | Kalinga | Mt. Province | |
| All Items | 118.5 | 115.8 | 121.9 | 119.5 | 116.2 | 123.6 | 113.7 |
|
Food and Non - Alcoholic |
120.9 | 119.3 | 122.3 | 120.5 | 117.3 | 125.8 | 122.3 |
|
Alcoholic Beverages and |
207.8 | 253.2 | 316.5 | 193.7 | 183.7 | 235.7 | 165.0 |
| Clothing and Footwear | 119.6 | 116.0 | 114.3 | 120.8 | 120.3 | 122.6 |
118.2 |
|
Housing, Water, Electricity, |
116.1 | 108.5 | 119.7 | 120.9 | 122.4 | 111.3 | 111.2 |
| Furnishing, Household Equipment and Routine Maintainance of the House |
112.3 |
111.2 |
116.7 |
111.4 | 112.4 | 123.2 | 108.6 |
| Health | 117.4 | 108.6 | 108.4 | 124.2 | 106.0 | 122.3 | 102.8 |
| Transport | 107.5 | 106.3 | 108.8 | 107.9 | 102.9 | 108.8 | 109.6 |
| Communication | 101.3 | 103.6 | 104.2 | 100.4 | 101.0 | 103.1 | 100.0 |
| Recreation and Culture | 106.2 | 109.4 | 119.9 | 103.6 | 106.1 | 115.3 | 103.8 |
| Education | 121.8 | 100.8 | 60.9 |
121.6 |
100.0 | 179.1 | 120.5 |
| Restaurants and Miscellaneous Goods and Services |
114.9 | 109.6 | 122.8 | 114.9 | 112.4 | 123.6 | 110.0 |
-
By index point change, Alcoholic Beverages and Tobacco recorded the highest increased by 36.9 points. Increases were also incurred in Health (8.0 points), Food and Non- Alcoholic Beverages (7.3 points), and Transport (7.2 points). The rest of the commodity groups reported minimal annual increases.
Figure 1. Year-on-Year Consumer Price Index by Commodity Group,
CAR: October 2017 and 2018 (2012=100)
Inflation Rate
-
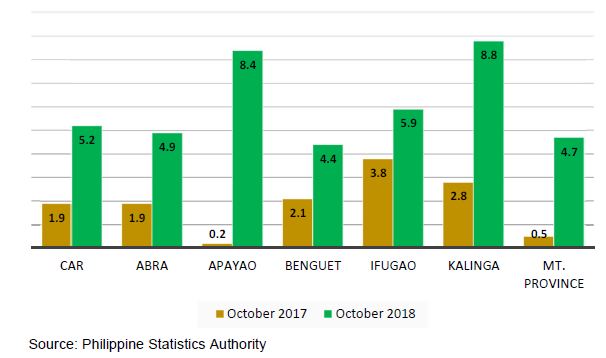
Average increase in prices of goods and services in the region accelerated from 1.9 percent in October 2017 to 5.2 percent in October 2018.
-
Kalinga posted the highest inflation rate at 8.8 percent, followed by Apayao at 8.4 percent, and Ifugao at 5.9 percent.
-
Inflation rates of all the provinces in October 2018 surpassed the October 2017 inflation rates. Apayao posted the highest acceleration with 8.2 percentage points, followed by Kalinga with 6.0 percentage points, and Mt. Province with 4.2 percentage points.
Figure 2. Year-on-Year Inflation Rates by Province, CAR:
October 2017 and 2018 (2012=100)
By Commodity Group, Year- on-Year
-
Year-on-year inflation rate of the heavily-weighted Food and Non-Alcoholic Beverages index in the region recorded no significant change as compared with the previous month.
-
Alcoholic Beverages and Tobacco had the highest inflation among other commodities in the region with 21.6 percent, followed by Health with 7.3 percent.
-
Education, having 2012=100 as base year, incurred a negative inflation rate with 1.3 percent.
Table 3. Inflation Rates by Commodity Groups,
CAR: September and October 2018 (2012=100)
| Commodity Group | Inflation Rates | |
|---|---|---|
| September 2018 | October 2018 | |
| All Items | 5.0 | 5.2 |
| Food and Non-Alcoholic Beverages | 6.4 | 6.4 |
| Alcoholic Beverages and Tobacco | 22.1 | 21.6 |
| Clothing and Footwear | 3.6 | 3.6 |
| Housing, Water, Electricity, Gas and Other Fuels | 3.6 | 4.3 |
| Furnishing, Household Equipment & Routine Maintenance of the House | 1.8 | 1.9 |
| Health | 6.4 | 7.3 |
| Transport | 6.3 | 7.2 |
| Communication | 0.1 | 0.1 |
| Recreation and Culture | 2.4 | 3.0 |
| Education | -1.3 | -1.3 |
| Restaurants and Miscellaneous Goods and Services | 2.7 | 2.9 |
By Food Items, Year-on-Year
-
Corn (22.5), Vegetables (21.8), and Fish (6.6) persisted to be the top three highest price increases.
-
On the other hand, Oils and Fats had the lowest inflation rate at 2.3 percent in October 2018.
Table 4. Year-on-Year Inflation Rates of Selected Food Items, CAR:
September and October 2017 and 2018 (2012=100)
| Food Items | 2017 | 2018 | Inflation Rates | |||
|---|---|---|---|---|---|---|
| September | October | September | October | Previous | Current | |
| Bread and Cereals | 113.5 | 113.5 | 118.2 | 118.7 | 4.1 | 4.6 |
| Rice | 113.8 | 113.7 | 118.6 | 119.1 | 4.2 | 4.7 |
| Corn | 132.3 | 132.3 | 160.4 | 162.0 | 21.3 | 22.5 |
| Other Cereals* | 111.4 | 111.5 | 114.3 | 115.1 | 2.6 | 3.2 |
| Meat | 112.9 | 112.8 | 118.4 | 119.7 | 4.9 | 6.1 |
| Fish | 111.6 | 112.4 | 119.2 | 119.8 | 6.8 | 6.6 |
| Milk, Cheese and Eggs | 110.8 | 111.0 | 115.4 | 115.7 | 4.2 | 4.2 |
| Oils and Fats | 111.4 | 111.4 | 113.1 | 114.0 | 1.5 | 2.3 |
| Fruits | 129.6 | 123.0 | 133.1 | 134.7 | 2.7 | 3.6 |
| Vegetables | 111.9 | 116.5 | 142.4 | 141.9 | 27.3 | 21.8 |
| Sugar, Jam, Honey, Chocolate & Confectionery | 108.0 | 107.7 | 112.1 | 112.4 | 3.8 | 4.4 |
| Food Products, N. E. C. | 105.2 | 104.3 | 107.9 | 107.6 | 2.6 | 3.2 |
Source: Philippine Statistics Authority
Purchasing Power of the Peso (PPP)
-
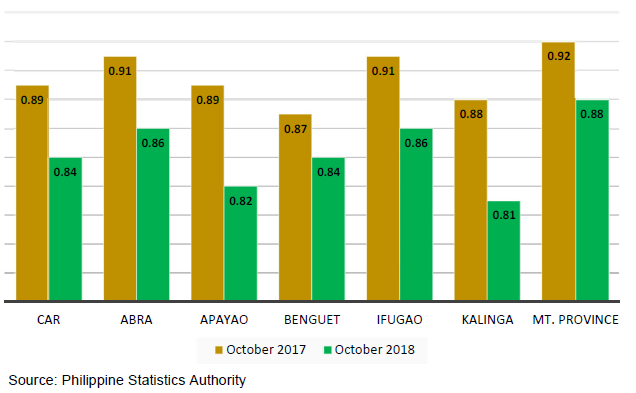
The value of the peso in the region was 84 centavos in October 2018. It dropped by five centavos from 89 centavos in October 2017. This means that one peso in 2012 is worth 84 centavos in October 2018.
-
In other words, a basket of goods that can be bought with 100 pesos in October 2012 is worth 118.5 pesos in October 2018.
-
The PPP in all the provinces generally weakened in October 2018 compared to the same month of the previous year.
-
Mountain Province had the highest peso value at 88 centavos. Meanwhile, Kalinga had the lowest peso value at 81 centavos.
Figure 3. Purchasing Power of the Peso by Province, CAR:
October 2017 and 2018
(2012=100)
Technical Notes
Consumer Price Index (CPI) is a general measure of the change in the average retail prices of a market basket or collection of goods and services commonly purchased by the average Filipino household.
Inflation Rate (IR) is the rate of change in the average price level between two periods (year-on year/month-on-month as measured by the CPI)
Purchasing Power of the Peso (PPP) measures how much the peso in the reference year is worth in another year
Base Year (BY) is the reference point of the index number series, at which the index number is set to 100. It is the reference point of the index number series.
The CPI is now rebased to 2012 base year from the current 2006 base year. The year 2012 was chosen as the next base year because it was the latest year when the Family Income and Expenditure Survey (FIES) results were made available. It is also the synchronized rebasing of the price indices to base year 2006 and every six years thereafter.
Market Basket (MB) is a sample of goods and services used to represent all goods and services produced or bought.
