

Consumer Price Index
- Consumer Price Index (CPI) is the general measure of the change in the average retail prices of a market basket or collection of goods and services commonly purchased by the average Filipino household.
- The CPI of the Cordillera Administrative Region (CAR) in June 2018 was 151.0. This was higher by 7.0 index points from the 144.0 CPI of June 2017.
- In general, the CPI increased reflecting the rise in the average prices of goods and services in all the six provinces of CAR.
Table 1. Consumer Price Index by Province, CAR:
June 2017 and 2018
(2006=100)
| Province | June | Index Point Change | |
|---|---|---|---|
| 2017 | 2018 | ||
| CAR | 144.0 | 151.0 | 7.0 |
| Abra | 136.0 | 140.5 | 4.5 |
| Apayao | 132.0 | 138.7 | 6.7 |
| Benguet | 144.7 | 151.6 | 6.9 |
| Ifugao | 151.1 | 157.5 | 6.4 |
| Kalinga | 141.0 | 150.1 | 9.1 |
| Mt. Province | 155.3 | 164.9 | 9.6 |
- Among the CAR provinces, Mountain Province posted the highest CPI for June 2018 at 164.9, followed by Ifugao at 157.5, and Benguet at 151.6. Apayao posted the lowest CPI at 138.7.
- In terms of index point change, Mt. Province incurred the highest increase at 9.6 index points, followed by Kalinga with 9.1 points, and Benguet with 6.9 points.
CPI by Commodity Groups
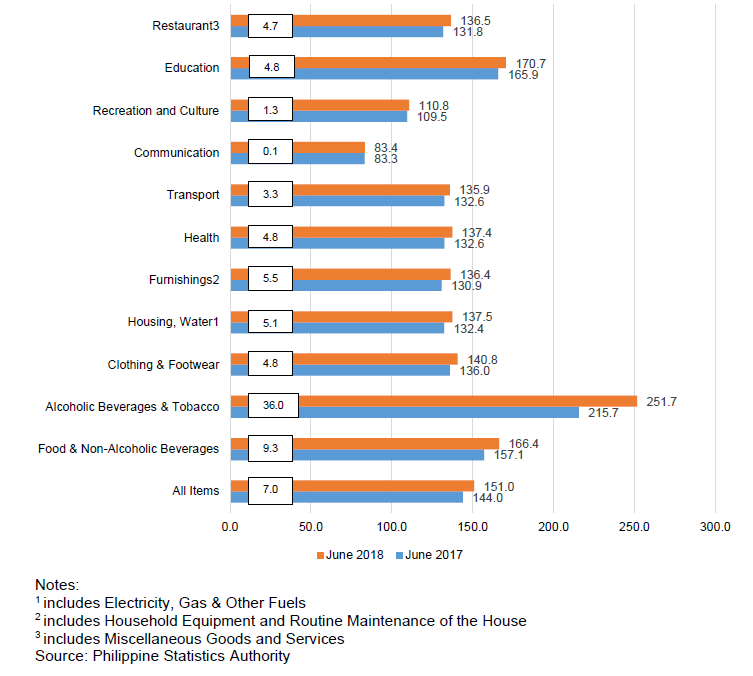
- Among the commodity groups, Alcoholic Beverages and Tobacco had the highest CPI in the region at 251.7. The province of Benguet incurred the highest CPI on this commodity at 264.1, followed by Abra, Apayao, and Kalinga at 259.7, 255.9, and 252.8, respectively.
- Education registered the second highest CPI among the commodity groups in the region for June 2018 at 170.7 index points. Among the provinces, Mountain Province had the highest index on education at 258.2, while Benguet had the lowest at 150.0.
- Food and Non-Alcoholic Beverages ranked third at 166.4 index points. Mt Province recorded the highest index on food and non-alcoholic beverages at 174.5, followed by Benguet and Ifugao at 171.7 and 166.3 index points, respectively.]
- Communication continued to have the lowest CPI among the commodity groups in the region with 83.4 index. The province of Abra incurred the highest index on communication with 111.4 index points, while Apayao had the lowest at 79.0 index points.
- Among the CAR provinces, Mountain Province consistently incurred the highest CPI for all items with 164.9, while the province of Apayao continued to have the lowest index at 138.7.
Table 2. Consumer Price Index by Commodity Group and by Province, CAR:
June 2018 (2006=100)
| Commodity Group | Region/Province | ||||||
|---|---|---|---|---|---|---|---|
| CAR | Abra | Apayao | Benguet | Ifugao | Kalinga | Mt. Province | |
| All Items | 151.0 | 140.5 | 138.7 | 151.6 | 157.5 | 150.1 | 164.9 |
|
Food and Non - Alcoholic |
166.4 |
150.9 | 156.8 | 171.7 | 166.3 | 163.1 | 174.5 |
|
Alcoholic Beverages and |
251.7 | 259.7 | 255.9 | 264.1 | 221.4 | 252.8 | 223.0 |
| Clothing and Footwear | 140.8 | 153.1 | 125.8 | 136.8 | 162.7 | 125.3 |
152.3 |
|
Housing, Water, Electricity, |
137.5 | 115.7 | 102.1 | 149.4 | 146.7 | 120.9 | 136.9 |
| Furnishing, Household Equipment and Routine Maintainance of the House |
136.4 | 126.1 | 123.3 | 136.4 | 128.6 | 148.1 | 153.4 |
| Health | 137.4 | 125.3 | 117.3 | 142.3 | 123.7 | 139.7 | 140.8 |
| Transport | 135.9 | 151.2 | 121.7 | 134.3 | 134.2 | 148.7 | 132.5 |
| Communication | 83.4 | 111.4 | 78.7 | 80.1 | 101.0 | 79.0 | 87.4 |
| Recreation and Culture | 110.8 | 112.6 | 120.3 | 106.8 | 111.4 | 116.8 | 116.7 |
| Education | 170.7 | 171.8 | 163.6 |
150.0 |
184.6 | 172.0 | 258.2 |
| Restaurants and Miscellaneous Goods and Services |
136.5 | 121.7 | 139.2 | 129.7 | 161.1 | 139.1 | 173.5 |
- By index point change, Alcoholic Beverages and Tobacco recorded the highest which increased by 36.0 points. Increases were also incurred in Food and Non-Alcoholic beverages (9.3 points), Furnishings Household Equipment and Routine Maintenance of the House (5.5 points), and Housing and Water (5.1 points). The rest of the commodity groups reported minimal annual increases.
Figure 1. Year-on-Year Consumer Price Index by Commodity Group,
CAR: June 2017 and 2018 (2006=100)
Inflation Rate
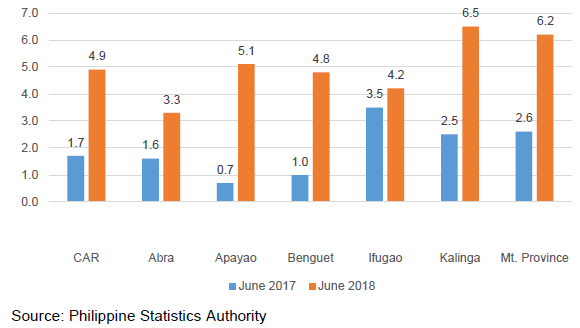
- Average increase in prices of goods and services in the region accelerated to 4.9 percent in June 2018 from 1.7 percent in the same month of the previous year.
- Kalinga posted the highest inflation rate at 6.5 percent, followed by Mt. Province at 6.2 percent, and Benguet at 5.1 percent.
- Inflation surpassed the June 2017 rates for all the provinces.
Figure 2. Year-on-Year Inflation Rates by Province, CAR:
June 2017 and 2018 (2006=100)
By Commodity Group, Year- on-Year
- Year-on-year inflation rate of the heavily-weighted Food and Non-Alcoholic Beverages index in the region decelerated to 5.9 percent from 6.5 percent in the previous month.
- Alcoholic Beverages & Tobacco had the highest inflation among other commodities in the region with 16.7 percent.
- Meanwhile, inflation rates for Communication were the same last month.
Table 3. Year-on-Year Inflation Rates by Commodity Groups,
CAR: May and June 2018 (2006 = 100)
| Commodity Group | Inflation Rates | |
|---|---|---|
| May | June | |
| All Items | 4.9 | 4.9 |
| Food and Non-Alcoholic Beverages | 6.5 | 5.9 |
| Alcoholic Beverages and Tobacco | 15.1 | 16.7 |
| Clothing and Footwear | 3.2 | 3.2 |
| Housing, Water, Electricity, Gas and Other Fuels | 3.2 | 3.9 |
| Furnishing, Household Equipment & Routine Maintenance of the House | 3.9 | 4.2 |
| Health | 2.9 | 3.6 |
| Transport | 2.0 | 2.5 |
| Communication | 0.1 | 0.1 |
| Recreation and Culture | 1.1 | 1.2 |
| Education | 3.5 | 2.9 |
| Restaurants and Miscellaneous Goods and Services | 3.4 | 3.6 |
By Food Items, Year-on-Year
- Corn (12.3), Fish (10.9), and Vegetables (7.2) persisted to be the top three highest price increases in June 2018.
Table 4. Year-on-Year Inflation Rates of Selected Food Items, CAR:
May and June 2017 and 2018 (2006 = 100)
| Food Items | 2018 | 2017 | Inflation Rates | |||
|---|---|---|---|---|---|---|
| May | June | May | June | Previous | Current | |
| Bread and Cereals | 164.4 | 164.8 | 155.9 | 156.0 | 5.5 | 5.6 |
| Rice | 162.3 | 162.4 | 152.7 | 152.9 | 6.3 | 6.2 |
| Corn | 193.8 | 198.2 | 175.1 | 176.5 | 10.7 | 12.3 |
| Other Cereals* | 170.2 | 171.2 | 165.9 | 165.8 | 2.6 | 3.3 |
| Meat | 143.8 | 145.4 | 135.1 | 137.8 | 6.4 | 5.5 |
| Fish | 200.5 | 197.9 | 178.2 | 178.4 | 12.5 | 10.9 |
| Milk, Cheese and Eggs | 145.3 | 145.5 | 140.4 | 140.6 | 3.5 | 3.5 |
| Oils and Fats | 190.2 | 191.4 | 182.9 | 184.3 | 4.0 | 3.9 |
| Fruits | 199.3 | 199.0 | 196.0 | 194.2 | 1.7 | 2.5 |
| Vegetables | 186.6 | 187.1 | 168.4 | 174.5 | 10.8 | 7.2 |
| Sugar, Jam, Honey, Chocolate & Confectionery | 138.8 | 143.0 | 138.3 | 138.3 | 0.4 | 3.4 |
| Food Products, N. E. C. | 160.8 | 161.0 | 158.3 | 158.3 | 1.6 | 1.7 |
Source: Philippine Statistics Authority
Purchasing Power of the Peso (PPP)
-
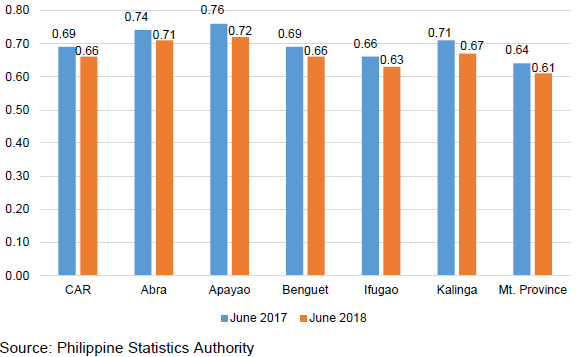
The value of the peso in the region was 66 centavos in June 2018. This dropped by three centavos from 69 centavos in June 2017. This means that one peso in 2006 is worth 67 centavos in June 2018.
-
In other words, a basket of goods that can be bought 100 pesos in 2006 is worth 152 pesos in June 2018.
-
The PPP in all the provinces generally weakened in June 2018 as compared to June 2017.
-
Apayao had the highest peso value at 72 centavos. Meanwhile, Mountain Province had the lowest peso value at 61 centavos.
Figure 3. Purchasing Power of the Peso by Province, CAR:
June 2017 and 2018
(2006=100)
Technical Notes
Consumer Price Index (CPI) is a general measure of the change in the average retail prices of a market basket or collection of goods and services commonly purchased by the average Filipino household.
Inflation Rate (IR) is the rate of change in the average price level between two periods (year-on year/month-on-month as measured by the CPI)
Purchasing Power of the Peso (PPP) measures how much the peso in the reference year is worth in another year
Base Year (BY) is the reference point of the index number series, at which the index number is set to zero.
Market Basket (MB) is a sample of goods and services used to represent all goods and services produced or bought.
