

Consumer Price Index
-
Consumer Price Index (CPI) is the general measure of the change in the average retail prices of a market basket or collection of goods and services commonly purchased by the average Filipino household.
-
The CPI of the Cordillera Administrative Region (CAR) in October 2017 was 146.0. This was higher by 3.3 index points from the 142.7 CPI of October 2016.
-
In general, the CPI increased reflecting the rise in the average prices of goods and services in all the six provinces of CAR.
Table1. Consumer Price Index by Province, CAR:
OCtober 2016 and October 2017
(2006=100)
| Province | October | Index Point Change | |
|---|---|---|---|
| 2016 | 2017 | ||
| CAR | 142.7 | 146.0 | 3.3 |
| Abra | 135.1 | 138.3 | 3.2 |
| Apayao | 131.4 | 132.6 | 1.2 |
| Benguet | 144.0 | 146.9 | 2.9 |
| Ifugao | 148.7 | 153.0 | 4.3 |
| Kalinga | 138.4 | 142.0 | 3.6 |
| Mt. Province | 152.2 | 158.0 | 5.8 |
Source: Philippine Statistics Authority
-
Among the CAR provinces, Mountain Province posted the highest CPI for October 2017 at 158.0, followed by Ifugao at 153.0, and Benguet at 146.9. Apayao posted the lowest CPI at 132.6.
-
In terms of index point change, Mountain Province incurred the highest increase at 5.8 points, followed by Ifugao with 4.3 points increase.
Consumer Price Index by Commodity Groups
-
Among the commodity groups, Alcoholic Beverages and Tobacco had the highest CPI in the region at 220.4. The province of Kalinga incurred the highest CPI on this commodity at 235.7, followed by Abra, Apayao, and Benguet at 233.1, 229.1, and 220.6, respectively.
-
Education registered the second highest CPI among the commodity groups in the region for October 2017 at 167.5 index. Among the provinces, Mountain Province had the highest index on education at 258.2, while Apayao had the lowest at 142.2.
-
Food and Non-Alcoholic Beverages ranked third at 160.7 index points. Mountain Province recorded the highest index on food and non-alcoholic beverages at 167.2, followed by the province of Benguet and Ifugao at 166.5 and 162.0 index points, respectively.
-
Communication continued to have the lowest CPI among the commodity groups in the region with 83.3 index. The province of Abra incurred the highest index on this commodity at 111.4 points, while Apayao had the lowest at 78.6 index.
-
Among the CAR provinces, Mountain Province consistently incurred the highest CPI for all items with 158.0 index, while the province of Apayao continued to have the lowest index at 132.6 points.
Table2. Consumer Price Index by Commodity Group and by Province, CAR:
October 2017(2006=100)
| Commodity Group | Region/Province | ||||||
|---|---|---|---|---|---|---|---|
| CAR | Abra | Apayao | Benguet | Ifugao | Kalinga | Mt. Province | |
| All Items | 146.0 | 138.3 | 132.6 | 146.9 | 153.0 | 142.0 | 158.0 |
|
Food and Non - Alcoholic |
160.7 | 147.7 | 150.1 | 166.5 | 162.0 | 152.8 | 167.2 |
|
Alcoholic Beverages and |
220.4 | 233.1 | 229.1 | 220.6 | 198.5 | 235.7 | 194.4 |
| Clothing and Footwear | 137.3 | 151.2 | 121.2 | 134.3 | 152.5 | 124.0 | 146.2 |
|
Housing, Water, Electricity, |
133.3 | 117.4 | 100.3 | 143.3 | 146.1 | 112.8 | 132.6 |
| Furnishing, Household Equipment and Routine Maintainance of the House |
132.4 | 124.9 | 120.3 | 134.1 | 126.2 | 140.1 | 141.5 |
| Health | 133.0 | 124.4 | 113.6 | 138.7 | 116.7 | 128.5 | 139.4 |
| Transport | 132.6 | 148.9 | 115.8 | 131.2 | 131.9 | 145.3 | 125.1 |
| Communication | 83.3 | 111.4 | 78.6 | 79.9 | 101.0 | 79.0 | 87.4 |
| Recreation and Culture | 109.8 | 111.9 | 118.3 | 106.5 | 109.4 | 115.2 | 114.5 |
| Education | 167.5 | 162.5 | 142.2 |
150.0 |
173.6 | 172.0 | 258.2 |
| Restaurants and Miscellaneous Goods and Services |
132.5 | 121.0 | 134.6 | 127.4 | 150.2 | 135.0 | 160.8 |
Source: Philippine Statistics Authority
-
By index point change, Alcoholic Beverages and Tobacco recorded the highest which increased by 16.4 points. Increases were also incurred for Education (5.7 points), Clothing & Footwear (4.6 points), and Food and Non-alcoholic Beverages (3.7 points). The rest of the commodity groups reported minimal annual increases.
Figure 1. Year-on-Year Consumer Price Index by Commodity Group,
CAR: October 2016 and 2017 (2006=100)
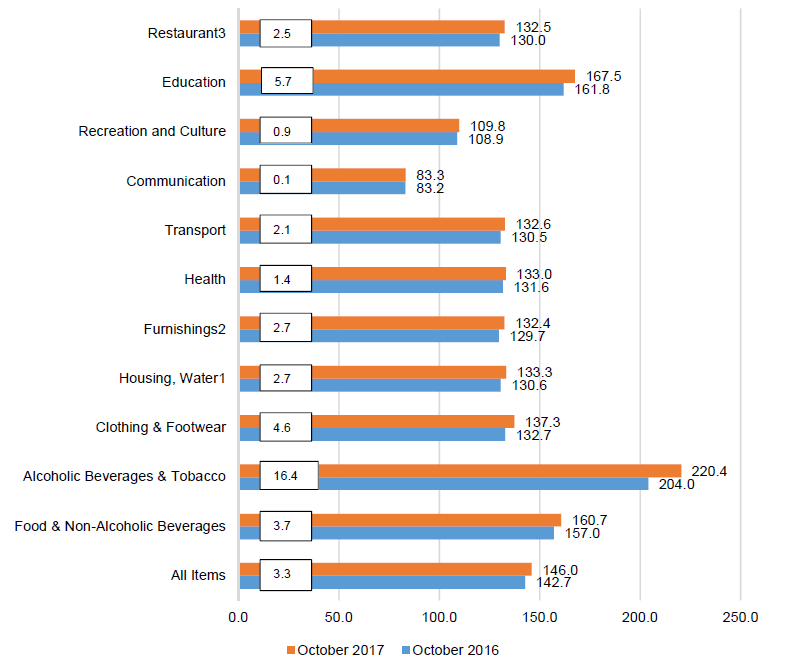
Note:
1. includes electricity, Gas & Other Fuels
2. includes Household Equipment and Routine Maintainance of the House
3. includes Miscellaneous Goods and Services
Source:Philippine Statistics Authority
Inflation Rate
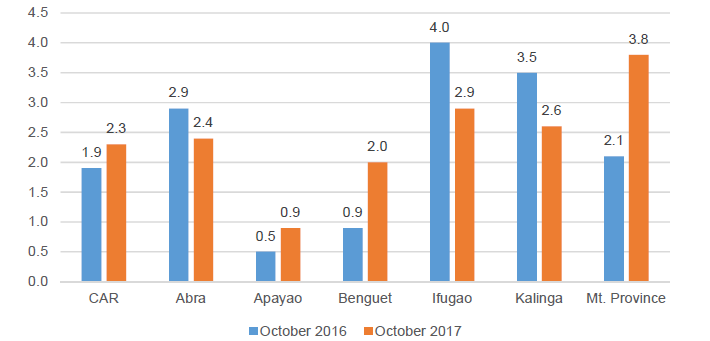
- Prices of goods and services in the region rose by 2.3 percent in October 2017.
-
Mountain Province posted the highest inflation rate at 3.8 percent, followed by Ifugao at 2.9 percent, and Kalinga at 2.6 percent.
-
Inflation surpassed the October 2017 rate for the province of Apayao, Benguet, and Mountain Province; while other provinces had lower inflation rates in October 2017 as compared to the same month last year.
Figure 2. Year-on-Year Inflation Rates by Province,
CAR: October 2016 and October 2017 (2006=100)
 SOURCE: Philippine Statistics Authority
By Commodity Group, Year - on - Year
-
By commodity, the year-on-year inflation rate of the heavily-weighted Food and Non- Alcoholic Beverages index in the region accelerated at 2.4 percent from 1.5 percent in the previous month.
-
Alcoholic Beverages & Tobacco had the highest inflation among other commodities in the region with 8.0 percent increase, followed by Education, and Clothing and Footwear, both garnering a 3.5 percent increase.
-
Meanwhile, inflation rates for Health, Communication, and Education were the same last year.
Table 3. Year-on-Year Inflation Rates by Commodity Groups,
CAR: September and October 2017 (2006 = 100)
| Commodity Group | Inflation Rates | |
|---|---|---|
| September 2017 | October 2017 | |
| All Items | 2.0 | 2.3 |
| Food and Non-Alcoholic Beverages | 1.5 | 2.4 |
| Alcoholic Beverages and Tobacco | 8.1 | 8.0 |
| Clothing and Footwear | 3.2 | 3.5 |
| Housing, Water, Electricity, Gas and Other Fuels | 1.9 | 2.1 |
| Furnishing, Household Equipment & Routine Maintenance of the House | 1.9 | 2.1 |
| Health | 1.1 | 1.1 |
| Transport | 2.1 | 1.6 |
| Communication | 0.1 | 0.1 |
| Recreation and Culture | 1.0 | 0.8 |
| Education | 3.5 | 3.5 |
| Restaurants and Miscellaneous Goods and Services | 1.8 | 1.9 |
By Food Items, Year - on - Year
-
Fish (5.7), Meat (5.0), and Corn (4.3) persisted to have the top three highest price increases in October 2017.
-
Meanwhile, Vegetables, Sugar, Jam, Honey, Chocolate and Confectionery, and Food Products not elsewhere classified consecutively incurred negative inflation rates of 0.1 percent, 1.6 percent, and 5.2 percent, respectively.
Table4. Year - on Year Inflation Rates of Selected Food Items, CAR:
Septemmber 2017 and 2016; OCtober 2017 and 2016(2006=100)
| Food Items | 2017 | 2016 | Inflation Rates | |||
|---|---|---|---|---|---|---|
| September | October | September | October | Previous | Current | |
| Bread and Cereals | 157.3 | 157.5 | 154.2 | 154.8 | 2.0 | 1.7 |
| Rice | 154.2 | 154.4 | 150.7 | 151.5 | 2.3 | 1.9 |
| Corn | 180.2 | 180.3 | 170.8 | 172.8 | 5.5 | 4.3 |
| Other Cereals* | 166.9 | 166.9 | 165.2 | 165.3 | 1.0 | 1.0 |
| Meat | 139.5 | 139.9 | 133.2 | 133.3 | 4.7 | 5.0 |
| Fish | 180.6 | 186.3 | 175.3 | 176.2 | 3.0 | 5.7 |
| Milk, Cheese and Eggs | 141.1 | 141.2 | 138.2 | 138.3 | 2.1 | 2.1 |
| Oils and Fats | 187.4 | 187.4 | 181.3 | 181.4 | 3.4 | 3.3 |
| Fruits | 196.9 | 200.4 | 191.8 | 197.6 | 2.7 | 1.4 |
| Vegetables | 180.3 | 188.0 | 188.7 | 188.2 | -4.5 | -0.1 |
| Sugar, Jam, Honey, Chocolate & Confectionery | 137.1 | 136.7 | 138.9 | 138.9 | -1.3 | -1.6 |
| Food Products, N. E. C. | 156.9 | 156.0 | 164.8 | 164.6 | -4.8 | -5.2 |
Source: Philippine Statistics Authority
Purchasing Power of Peso (PPP)
-
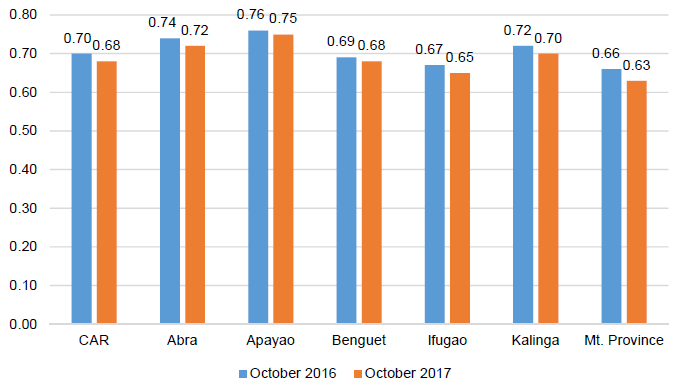
The value of the peso in the region was at 68 centavos in October 2017. This dropped by two centavos from 70 centavos in October 2016. This means that one peso in October 2006 is worth 68 centavos in October 2017.
-
In other words, a basket of goods that can be bought 100 pesos in October 2006 is worth 147 pesos in October 2017.
-
The PPP in all the provinces generally weakened in October 2017 as compared to October 2016.
-
Apayao had the highest peso value at 75 centavos, followed by Abra at 72 centavos, and Kalinga at 70 centavos. Meanwhile, Mountain Province had the lowest peso value at 63 centavos.
Figure 3. Purchasing Power of Peso by Province,
CAR: October 2016 and 2017 (2006=100)
 SOURCE: Philippine Statistics Authority
Technical Notes
Consumer Price Index (CPI) is a general measure of the change in the average retail prices of a market basket or collection of goods and services commonly purchased by the average Filipino household.
Inflation Rate (IR) is the rate of change in the average price level between two periods (year-on year/month-on-month as measured by the CPI)
Purchasing Power of the Peso (PPP) measures how much the peso in the reference year is worth in another year
Base Year (BY) is the reference point of the index number series, at which the index number is set to zero.
Market Basket (MB) is a sample of goods and services used to represent all goods and services produced or bought.
