

Consumer Price Index
- The Consumer Price Index (CPI) is the general measure of the change in the average retail prices of a market basket or collection of goods and services
commonly purchased by the average Filipino household. - The CPI of CAR in January 2017 was 143.8. This is higher by 2.7 indexpoints as compared to the 141.1 of the same month in 2016.
- In general, the CPI increased reflecting the rise in the average prices of goods and services on all the six provinces in CAR.
Table1. Consumer Price Index by Province, CAR:
January 2016 and January 2017
(2006=100)
| Province | January | Index Point Change | |
|---|---|---|---|
| 2016 | 2017 | ||
| CAR | 141.1 | 143.8 | 2.7 |
| Abra | 133.3 | 136.3 | 3.0 |
| Apayao | 131.5 | 132.3 | 0.8 |
| Benguet | 142.9 | 144.3 | 1.4 |
| Ifugao | 144.1 | 151.2 | 7.1 |
| Kalinga | 137.2 | 142.0 | 4.8 |
| Mt. Province | 150.4 | 154.1 | 3.7 |
Source: Philippine Statistics Authority
- Among the provinces in the region, Mountain Province posted the highest CPI for January 2017 at 154.1, followed by Ifugao at 151.2 and Benguet at 144.3. On the
other hand, Apayao posted the lowest CPI at 132.3 index points. - In terms of index point change, Ifugao incurred the highest increase at 7.1 points, while Apayao had the lowest increase at 0.8 index point.
Consumer Price Index by Commodity Groups
- Among the commodity groups, Alcoholic Beverages and Tobacco had the highest CPI in the region at 208.0. The province of Apayao and Kalinga incurred the highest both at 220.2, followed by Abra and Benguet at 219.3 and 209.2, respectively.
- Education registered the second highest CPI among the commodity groups in CAR for January 2017 at 161.8 index points. Among the provinces, Mountain Province had the highest index at 233.9 points, while Apayao had the lowest at 142.2 points.
- Food and Non-Alcoholic Beverages ranked third at 158.4 index points. Mountain Province experienced the highest CPI at 164.6 points, followed by Benguet province at 162.6 points.
- Communication had the lowest CPI among the commodity groups in the region with 83.3 index points. Abra province incurred the highest index at 111.4 points, while Apayao had the lowest at 78.1 index points.
- Among the CAR provinces, Mountain Province and Apayao consistently incurred the highest and lowest CPI for all items with 154.1 and 132.3 index points, respectively.
Table2. Consumer Price Index by Commodity Group and by Province, CAR:
January 2017(2006=100)
| Commodity Group | Province | ||||||
|---|---|---|---|---|---|---|---|
| CAR | Abra | Apayao | Benguet | Ifugao | Kalinga | Mt. Province | |
| All Items | 143.8 | 136.3 | 132.3 | 144.3 | 151.2 | 142.0 | 154.1 |
|
Food and Non - Alcoholic |
158.4 | 146.1 | 150.6 | 162.6 | 159.6 | 154.5 | 164.6 |
|
Alcoholic Beverages and |
208.0 | 219.3 | 220.2 | 209.2 | 182.9 | 220.2 | 185.8 |
| Clothing and Footwear | 134.6 | 150.8 | 117.9 | 130.6 | 149.7 | 123.4 | 144.7 |
|
Housing, Water, Electricity, |
131.5 | 115.9 | 100.8 | 140.3 | 145.6 | 113.3 | 131.4 |
| Furnishing, Household Equipment and Routine Maintainance of the House |
130.3 | 124.4 | 114.8 | 133.6 | 123.1 | 137.3 | 135.7 |
| Health | 132.2 | 123.8 | 111.1 | 138.4 | 115.8 | 127.5 | 135.7 |
| Transport | 132.6 | 148.3 | 114.8 | 131.4 | 131.5 | 145.6 | 124.9 |
| Communication | 83.3 | 111.4 | 78.1 | 79.9 | 101.0 | 78.9 | 87.4 |
| Recreation and Culture | 109.2 | 110.2 | 117.4 | 106.4 | 106.7 | 114.9 | 113.5 |
| Education | 161.8 | 152.4 | 142.2 | 147.3 | 173.2 | 166.6 | 233.9 |
| Restaurants and Miscellaneous Goods and Services |
131.3 | 119.8 | 133.1 | 127.1 | 150.8 | 133.2 | 153.0 |
Source: Philippine Statistics Authority
- By index point change, Alcoholic Beverages and Tobacco recorded the highest increasing by 13.8 points. Increases were also incurred for Transport (3.5 points), Food and Non alcoholic Beverages (3.4 points), and Restaurant, Miscellaneous Goods and Services (2.3 points).
- By index point change, Alcoholic Beverages and Tobacco recorded the highest increasing by 13.8 points. Increases were also incurred for Transport (3.5
points), Food and Non-alcoholic Beverages (3.4 points), and Restaurant, Miscellaneous Goods and Services (2.3 points). - The rest of the commodity groups reported a minimal annual increase in their index points.
Figure 1. Year-on-Year Consumer Price Index by Commodity Group,
CAR: January 2016 and January 2017 (2006=100)
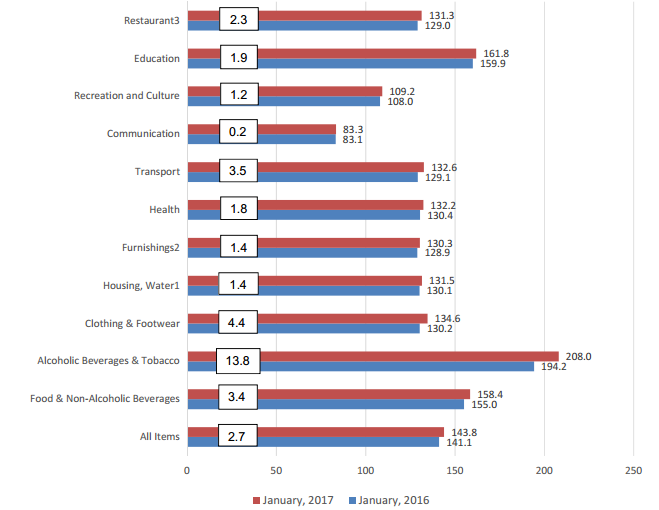
Note:
1. includes electricity, Gas & Other Fuels
2. includes Household Equipment and Routine Maintainance of the House
3. includes Miscellaneous Goods and Services
Source:Philippine Statistics Authority
Inflation Rate
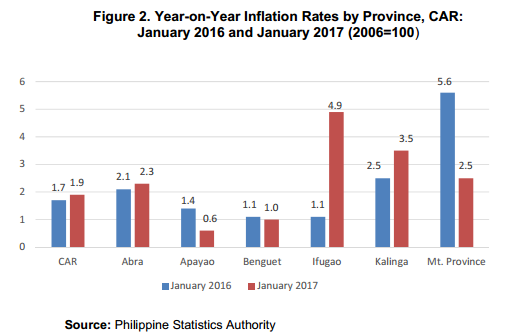
- Prices of goods and services in CAR increased by 1.9 percent in January 2017.
- Ifugao posted the highest inflation rate at 4.9 percent, followed by Kalinga with 3.5 percent, Mountain Province with 2.5 percent, and Abra with 2.3 percent.
- Inflation surpassed the January 2016 rates for the provinces of Abra, Kalinga and Ifugao. Apayao, Benguet and Mountain Province had lower inflation rates in January 2017 compared to the same month last year.
By Commodity Group, Year - on - Year
- By commodity, the year-on-year growth of the heavily-weighted Food and NonAlcoholic Beverages index in the region decreased by 2.2 percent as compared to 3.6 percent from the previous month.
- Alcoholic Beverages & Tobacco registered the highest inflation rate among other commodities in the region with 7.1 percent increase, followed by Clothing
and Footwear at 3.4 percent. - Inflation rate on Education remained at 1.2 percent.
Table 3. Year-on-Year Inflation Rates by Commodity Groups,
CAR: January 2017 and December 2016 (2006 = 100)
| Commodity Group | Inflation Rates | |
|---|---|---|
| December 2016 | January 2017 | |
| All Items | 2.3 | 1.9 |
| Food and Non-Alcoholic Beverages | 3.6 | 2.2 |
| Clothing and Footwear | 3.3 | 3.4 |
| Housing, Water, Electricity, Gas and Other Fuels | -0.5 | 1.1 |
| Furnishing, Household Equipment & Routine Maintenance of the House | 1.6 | 1.1 |
| Health | 1.6 | 1.4 |
| Transport | 2.0 | 2.7 |
| Communication | 0.1 | 0.2 |
| Recreation and Culture | 1.4 | 1.1 |
| Education | 1.2 | 1.2 |
| Restaurants and Miscellaneous Goods and Services | 2.1 | 1.8 |
By Food Items, Year - on - Year
- Vegetables (7.5), Fish (4.8), and Corn (3.7) persisted to have the highest price increase for January 2017.
- Meanwhile, Fruits and Food Products not elsewhere classified registered negative inflation rates of 0.9 and 6.9 percent, respectively.
Table5. Year - on Year Inflation Rates of Selected Food Items, CAR:
January 2017 and 2016; December 2016 and 2015(2006=100)
| Food Items | Jan. 2017 | Dec. 2016 | Jan. 2016 | Dec. 2015 | Inflation Rates | |
|---|---|---|---|---|---|---|
| Current | Previous | |||||
| Bread and Cereals | 155.2 | 155.0 | 152.4 | 152.4 | 1.8 | 1.7 |
| Rice | 152.0 | 151.7 | 148.6 | 148.2 | 2.3 | 2.4 |
| Corn | 174.2 | 173.6 | 168.0 | 159.5 | 3.7 | 8.8 |
| Other Cereals | 165.5 | 165.5 | 165.1 | 166.6 | 0.2 | -0.7 |
| Meat | 134.1 | 133.9 | 133.0 | 133.2 | 0.8 | 0.5 |
| Fish | 175.9 | 176.0 | 167.9 | 166.3 | 4.8 | 5.8 |
| Milk, Cheese and Eggs | 138.8 | 138.5 | 136.4 | 136.1 | 1.8 | 1.8 |
| Oils and Fats | 180.9 | 181.2 | 180.5 | 180.3 | 0.2 | 0.5 |
| Fruits | 203.3 | 206.9 | 205.1 | 204.6 | -0.9 | 1.1 |
| Vegetables | 195.1 | 210.7 | 181.5 | 180.5 | 7.5 | 16.7 |
| Sugar, Jam, Honey, Chocolate & Confectionery | 139.8 | 139.6 | 135.4 | 134.8 | 3.2 | 3.6 |
| Food Products, N. E. C. | 162.3 | 163.9 | 174.3 | 173.9 | -6.9 | -5.8 |
Purchasing Power of Peso (PPP)
-
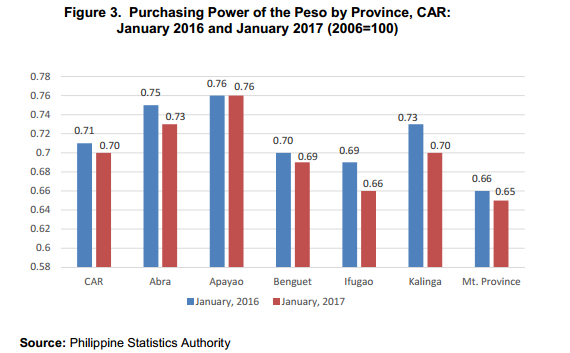
The value of the peso in the region for January 2017 was at 70 centavos, a decrease of one centavo from 71 centavos in January 2016. This means that
one peso in January 2017 is worth 70 centavos in January 2006. -
The PPP of all the provinces generally declined in January 2017 as compared to January 2016, except for Apayao which remained at 0.76 centavos.
-
Apayao had the highest peso value at 76 centavos, followed by Abra at 73 centavos and Kalinga at 70 centavos. Meanwhile, Mountain Province had the lowest peso value at 65 centavos.
Technical Notes
Consumer Price Index (CPI) is a general measure of the change in the average retail prices of a market basket or collection of goods and services commonly purchased by the average Filipino household.
Inflation Rate (IR) is the rate of change in the average price level between two periods (year-on year/month-on-month as measured by the CPI)
Purchasing Power of the Peso (PPP) measures how much the peso in the reference year is worth in another year
Base Year (BY) is the reference point of the index number series, at which the index number is set to zero.
Market Basket (MB) is a sample of goods and services used to represent all goods and services produced or bought.
