

Table A. Year-on-Year Inflation Rates, All Items
In percent
(2018=100)
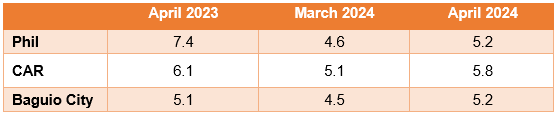
Figure 1. Inflation Rates in CAR, All Items
(2018=100)
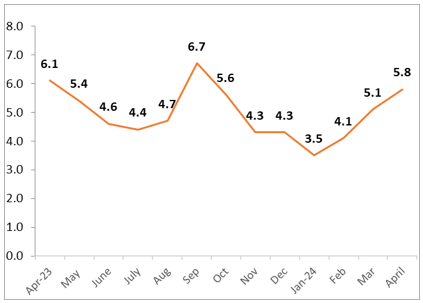
Source: Retail Price Survey of Commodities for the Generation of Consumer Price Index, Philippine Statistics Authority
Figure 2. Inflation Rates in Baguio City, All Items
(2018=100)
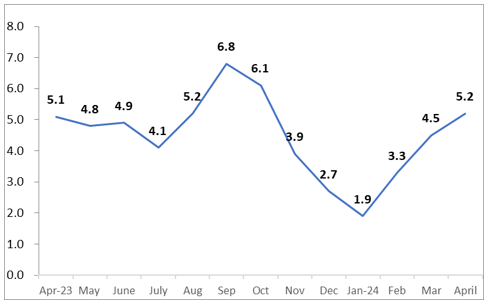
Source: Retail Price Survey of Commodities for the Generation of Consumer Price Index, Philippine Statistics Authority
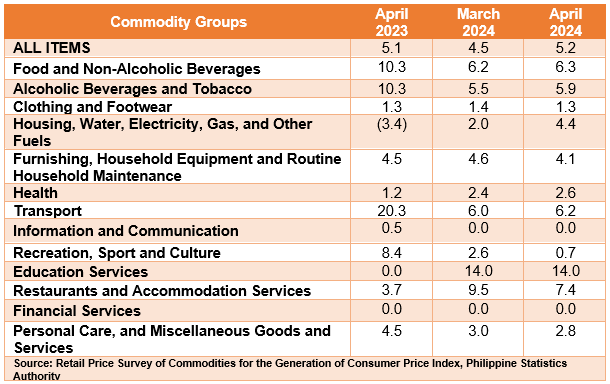
Table B. Year-on-Year Inflation Rates in Baguio City
By Commodity Groups
In percent
(2018=100)
Baguio City
Following the trend of the inflation at the national and regional level, inflation in Baguio City further increased to 5.2 percent in April 2024, from 4.5 percent in March 2024. In April 2023, inflation was lower at 5.1 percent. (Table B and Figure 2)
The main driver in the uptrend of inflation for this group in March 2024 was housing, water, electricity, gas and other fuels at 4.4 percent, from 2.0 percent in the previous month. This was followed by food and non-alcoholic beverages at 6.3 percent from 6.2 percent, and transport at 6.2 percent from the 6.0 percent in the previous month. Moreover, the following also increased during the month:
a. Alcoholic beverages and tobacco, 5.9 percent from 5.5 percent;
b. Health, 2.6 percent from 2.4 percent;
On the contrary, decreases were observed in the index of the following:
a. Clothing and footwear, 1.3 percent from 1.4 percent;
b. Furnishings, household equipment and routine household maintenance, 4.1 percent from 4.6 percent; and
c. Recreation, sport and culture, 0.7 percent from 2.6 percent;
d. Restaurants and accommodation services, 7.4 percent from 9.5 percent; and
e. Personal care, and miscellaneous goods and services, 2.8 percent from 3.0 percent.
Meanwhile, no change recorded for the rest of the commodity groups.
Food Inflation
Food inflation for the bottom 30% income households at the city level moved at a faster pace of 6.6 percent in April 2024 from 6.5 percent in the previous month. In April 2023, its annual increase was observed at 10.5 percent.
Main Drivers to the Upward Trend of the Food Inflation
The uptrend in the food inflation was mainly due to the increase in vegetable, tubers, plantains, cooking bananas and pulses at 4.3 percent from -2.2 percent, meat and other parts of slaughtered animals at 1.6 percent from 1.0, and sugar, confectionery and desserts, -5.0 percent from -7.4 percent.
Moreover, milk, other dairy products and eggs also increased at -1.2 percent from -2.3 percent, and ready-made food and other food products at 5.7 percent from 5.6 percent.
On the contrary, decreases were observed in the index of the following:
a. Fish and other seafood, 2.2 percent from 4.3 percent;
b. Oils and fats, -3.8 percent from -3.2 percent; and
c. Fruits and nuts, 9.3 percent from 15.9 percent.
Note: CPIs and inflation rates by region, province and selected city are posted at the PSA website (https://openstat.psa.gov.ph/).
IMELDA L. BUYUCCAN(SGD)
Chief Statistical Specialist
/SMBP
