

Table A. Year-on-Year Inflation Rates, All Items
In percent
(2018=100)
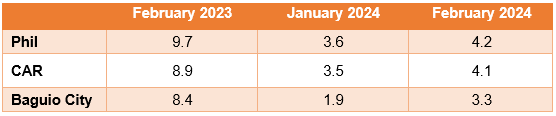
Figure 1. Inflation Rates in CAR, All Items
(2018=100)
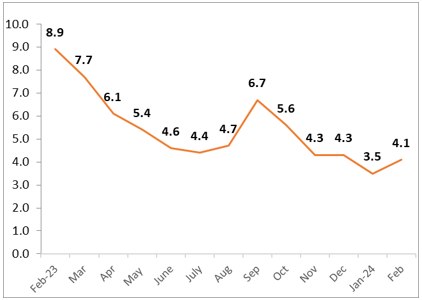
Source: Retail Price Survey of Commodities for the Generation of Consumer Price Index, Philippine Statistics Authority
Figure 2. Inflation Rates in Baguio City, All Items
(2018=100)
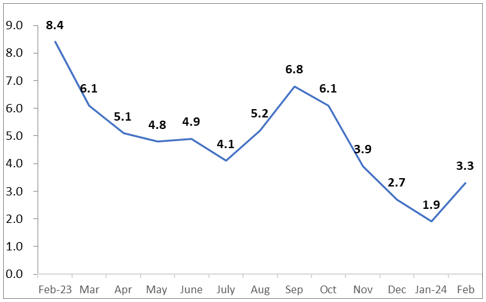
Source: Retail Price Survey of Commodities for the Generation of Consumer Price Index, Philippine Statistics Authority
Table B. Year-on-Year Inflation Rates in Baguio City
By Commodity Groups
In percent
(2018=100)
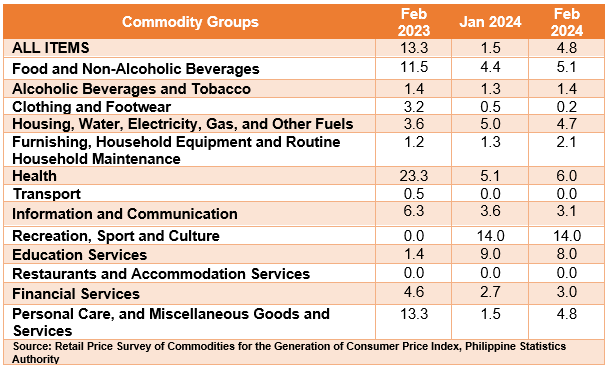
Source: Retail Price Survey of Commodities for the Generation of Consumer Price Index, Philippine Statistics Authority
1. Philippines
The country’s inflation rate for the bottom 30% income households increased to 4.2 percent in February 2024 from 3.6 percent in January 2024. In February 2023, inflation rate was posted at 9.7 percent.
The main driver to the upward trend of the overall inflation for this income group in February 2024 was the higher year-on-year growth in the heavily-weighted food and non-alcoholic beverages at 6.4 percent from 5.2 percent in the previous month. This was followed by transport, which posted a higher annual increase of 1.8 percent during the month from 0.3 percent in January 2024, and housing, water, electricity, gas and other fuels index, which registered slower annual decline of 2.8 percent in February 2024 from 3.1 percent annual decrease in the previous month.
Higher annual increments were also noted in the indices of alcoholic beverages and tobacco at 9.5 percent in February 2024 from 9.4 percent in the previous month, and information and communication at 0.7 percent during the month from 0.6 percent in January 2024.
In contrast, lower annual growth rates were noted in the indices of clothing and footwear at 3.7 percent in February 2024 from 3.9 percent in the previous month, and restaurants and accommodation services at 5.2 percent during the month from 5.4 percent January 2024.
The indices of the rest of the commodity groups retained their respective previous month’s annual rates.
Food Inflation
Food inflation for the bottom 30% income households at the national level moved at a faster pace of 6.5 percent in February 2024 from 5.3 percent in the previous month. In February 2023, its annual increase was observed at 10.5 percent. (Table 9)
Main Drivers to the Upward Trend of the Food Inflation
The uptrend in the food inflation was mainly due to the slower annual decrease in vegetables, tubers, plantains, cooking bananas and pulses at 11.7 percent during the month from 18.5 percent annual decrease in the January 2024. In addition, faster year-on-year increases were observed in the indices of cereals and cereal products, which includes rice, corn, flour, bread and other bakery products, pasta products, and other cereals, at 18.9 percent in February 2024 from 17.8 percent in the previous month, and meat and other parts of slaughtered land animals at 0.9 percent from 0.4 percent.
2. Cordillera Administrative Region (CAR)
Similar to the national trend, inflation in the region for the bottom 30% income households increased to 4.1 percent in February 2024, from 3.5 percent in January 2024. In February 2023, inflation was higher at 8.9 percent. (Figure 1)
The main driver to the upward trend of the overall inflation for this income group in February 2024 was the higher year-on-year growth in the heavily-weighted food and non-alcoholic beverages at 6.9 percent from 5.5 percent in the previous month. This was followed by transport, which posted a higher annual increase of 3.5 percent during the month from 2.5 percent in January 2024, and restaurants and accommodation services, which registered 3.1 percent in February 2024 from 2.5 percent in the previous month.
Higher annual increments were also noted in the indices of the following:
a. Alcoholic beverages and tobacco, 5.3 percent from 4.9 percent;
b. Furnishings, household equipment and routine household maintenance, 2.4 from 2.2 percent; and
c. Personal care and miscellaneous goods, 2.0 percent from 1.8 percent.
In contrast, lower annual growth rates were noted in the indices of housing, water, electricity, gas and other fuels at -1.6 percent in February 2024 from -0.6 percent in the previous month, and health at 3.5 percent during the month from 3.6 percent January 2024.
The indices of the rest of the commodity groups retained their respective previous month’s annual rates.
Food Inflation
Food inflation for the bottom 30% income households at the regional level moved at a faster pace of 7.2 percent in February 2024 from 5.5 percent in the previous month. In February 2023, its annual increase was observed at 9.4 percent.
Main Drivers to the Upward Trend of the Food Inflation
The uptrend in the food inflation was mainly due to the increase in rice at 23.8 percent from 21.4 percent, vegetable, tubers, plantains, cooking bananas and pulses at -11.2 percent from -17.0 percent and meat and other parts of slaughtered land animals at -0.1 percent from -0.3 percent.
3. Baguio City
Following the trend of the inflation at the national and regional level, inflation in Baguio City increased to 3.3 percent in February 2024, from 1.9 percent in January 2024. In February 2023, inflation was higher at 8.4 percent. (Table B and Figure 2)
The main driver in the uptrend of inflation for this group in February 2024 was food and non-alcoholic beverages at 4.8 percent, from 1.5 percent in the previous month. This was followed by transport at 6.0 percent from 5.1 percent, and health at 2.1 percent, from the 1.3 percent in the previous month. Moreover, the following also increased during the month:
a. Alcoholic beverages and tobacco, 5.1 percent from 4.4 percent;
b. Clothing and footwear, 1.4 percent from 1.3 percent; and
c. Personal care, and miscellaneous goods and services, 3.0 percent from 2.7 percent.
On the contrary, decreases were observed in the index of the following:
a. Housing, water, electricity, gas and other fuels, 0.2 percent from 0.5 percent;
b. Furnishings, household equipment and routine household maintenance, 4.7 percent from 5.0 percent;
c. Recreation, sport and culture, 3.1 percent from 3.6 percent;
d. Restaurants and accommodation services, 8.0 percent from 9.0 percent.
Meanwhile, no change recorded for the rest of the commodity groups.
Food Inflation
Food inflation for the bottom 30% income households at the city level moved at a faster pace of 4.9 percent in February 2024 from 1.4 percent in the previous month. In February 2023, its annual increase was observed at 13.8 percent.
Main Drivers to the Upward Trend of the Food Inflation
The uptrend in the food inflation was mainly due to the increase in rice at 21.0 percent from 16.3 percent, vegetable, tubers, plantains, cooking bananas and pulses at -14.2 percent from -25.9 percent, and meat and other parts of slaughtered land animals at 1.6 percent from 0.3 percent. Increases were also recorded for the following:
a. Corn, 25.7 percent from 22.6 percent;
b. Flour, Bread and Other Bakery Products, Pasta Products, and Other Cereals, 6.6 percent from 5.9 percent;
c. Oils and fats, -2.9 percent from -4.0 percent;
d. Fruits and Nuts, 14.1 percent from 13.1 percent; and
e. Ready-made food and other food products n.e.c, 6.0 percent from 5.5 percent.
On the contrary, decreases were observed in the index of the following:
a. Fish and other seafood, 0.5 percent from 2.5 percent;
b. Milk, other dairy products and eggs, 2.9 percent from 7.3 percent;
c. Sugar, confectionery and desserts, -6.8 percent from -6.3 percent; and
Note: CPIs and inflation rates by region, province and selected city are posted at the PSA website (https://openstat.psa.gov.ph/).
(SGD)
IMELDA L. BUYUCCAN
Chief Statistical Specialist
/SMBP
