

Table A: Year-on-Year Inflation Rates for All Items in CAR
In Percent
(2018=100)
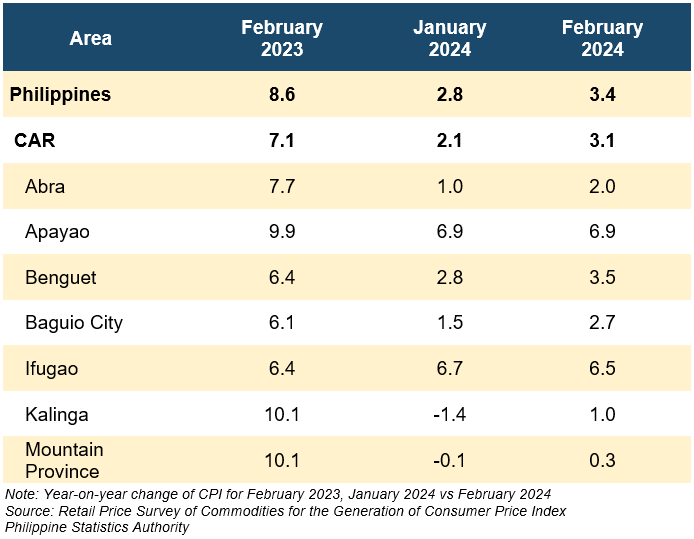
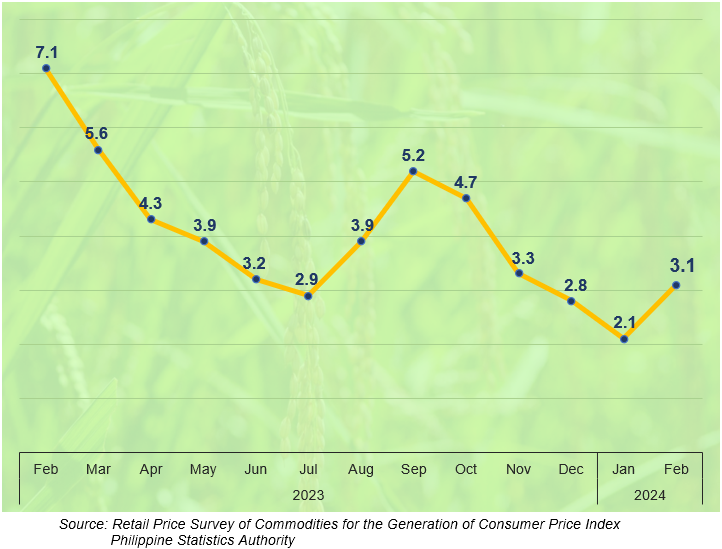
Figure 1: Inflation Rates in Cordillera Administrative Region, All Items:
February 2023 - February 2024 (2018=100)
1. Cordillera Administrative Region (CAR)
After deceleration for four months, the inflation rate in the Cordillera Administrative Region (CAR) accelerated to 3.1% in February 2024 from 2.1% in January 2024. In February 2023, the inflation rate in the region was higher with 7.1% (Table A and Figure 1).
1.1 Main Drivers to the Upward Trend of Inflation in Cordillera
The primary contributor to the upward trend in inflation in February 2024 was the acceleration in the annual increase of the heavily-weighted Food and Non-alcoholic Beverages, with an inflation rate of 4.5%, from 2.5% in January 2024. This commodity group accounted for a 76.9% share in the overall inflation uptrend in the region. Another commodity group with a significant contribution is Transport, with 18.5% share in the inflation uptrend and an inflation rate of 3.2% from 1.4% in January 2024 (Table B and Figure 1).
Table B: Year-on-Year Inflation Rates for Commodity Group in CAR
In Percent (2018=100)
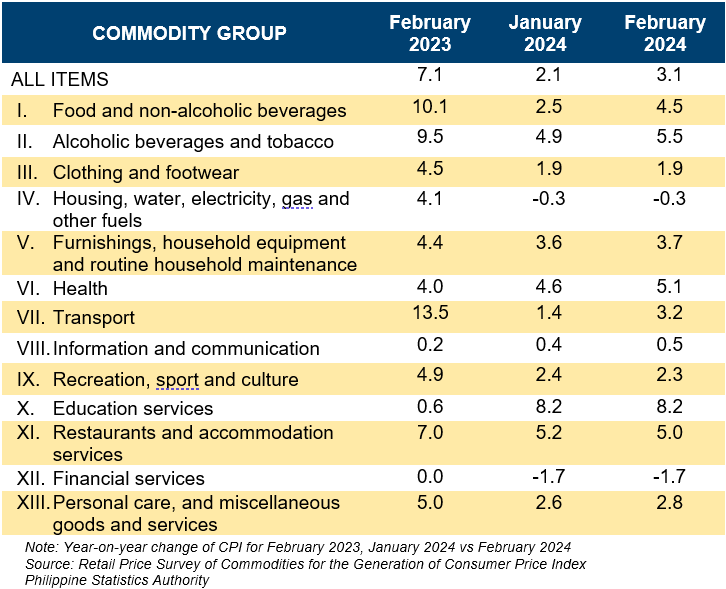
In addition, higher annual growth rates were noted in the indices of the following commodity groups during the month:
a. Health, 5.1% from 4.6%;
b. Alcoholic Beverages and Tobacco, 5.5% from 4.9%;
c. Personal Care, and Miscellaneous Goods and Services, 2.8% from 2.6%;
d. Information and Communication, 0.5% from 0.4%; and
e. Furnishings, Household Equipment and Routine Household Maintenance, 3.6% from 3.9%.
Conversely, two commodity groups exhibited higher inflation rates:
a. Restaurants and Accommodation Services, 5.0% from 5.2%; and
b. Recreation, Sport and Culture, 2.3% from 2.4%.
Meanwhile, commodity groups retained same rates:
a. Clothing and Footwear, 1.9%; and
b. Education Services, 8.2%.
Commodity groups with retained deflation rates:
a. Financial Services, -1.7%
b. Housing, Water, Electricity, Gas and Other Fuels, -0.3%
1.2 Main Contributors to Cordillera Inflation
In terms of contribution to the February 2024 inflation the Food and Non-alcoholic Beverages was the highest contributor with a 54.2% share or 1.6 percentage points to the 3.1% inflation in CAR. This was followed by:
a. Transport with 10.3% share or 0.3 percentage points; and
b. Education Services with a 10.1% share or 0.3 percentage points.
2. Food Inflation in CAR
Food inflation in the region rose to 4.5% in February 2024, from 2.5% in January 2024. In February 2023, food inflation was higher at 10.4% (Table C).
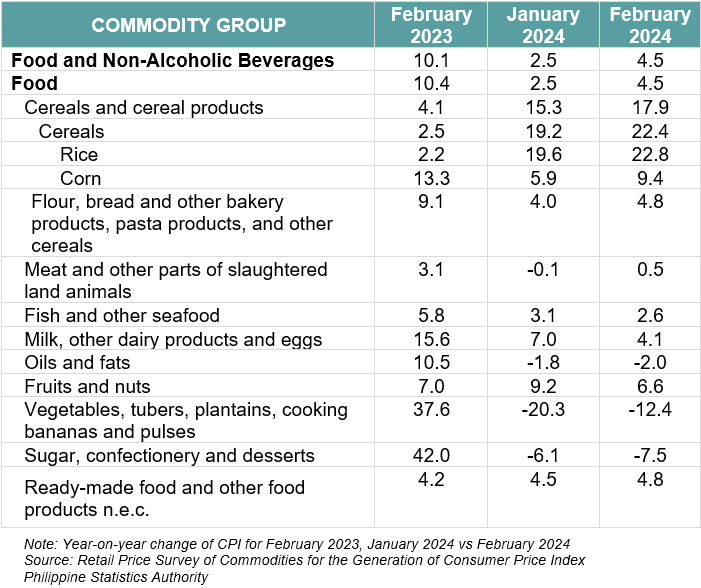
2.1 Main Drivers of the Downward Trend in Food Inflation
The acceleration of food inflation in February 2024 was mainly brought about by the faster year-on-year growth in Cereals and Cereal Products, which includes Rice, Corn, and Flour, Bread and Other Bakery Products, Pasta Products, and Other Cereals, accounting for a 49.0% share in the uptrend. This food group registered an inflation rate of 17.9%, from 15.3% in January 2024. Vegetables, Tubers, Plantains, Cooking Bananas, and Pulses, also contributed to the upward trend in the Region. It registered slower year-on-year deflation with -12.4%, from -20.3% in January 2024, accounting for a 44.8% share in the uptrend.
In addition, higher annual growth rates were noted in the indices of the following commodity groups during the month:
a. Meat and Other Parts of Slaughtered Land Animals, 0.5% from -0.1%; and
b. Ready-made Food and Other Food Products n.e.c., 4.8% from 4.5%.
In contrast, slower year-on-year inflation rates were observed in the indices of the following food items:
a. Fish and Other Seafood, 2.6% from 3.1%;
b. Milk, Other Dairy Products and Eggs, 4.1% from 7.0%;
c. Sugar, Confectionery and Desserts, -7.5% from -6.1%;
d. Oils and Fats, -2.0% from -1.8%; and
e. Fruits and Nuts, 6.6% from 9.2%.
3. Provinces/ Highly Urbanized City (HUC) in CAR
Among the provinces and highly urbanized city, four provinces and the city of Baguio, registered an acceleration in their inflation rates in February 2024. Apayao recorded the highest inflation in the region with 6.9%, followed by Ifugao with 6.5%. On the other hand, Mountain Province recorded the slowest inflation rate with 0.3%.
Provinces/Highly Urbanized City with higher inflation rates:
a. Abra: 2.0%, from 1.0%;
b. Baguio City: 2.7%, from 1.5%;
c. Benguet: 3.5%, from 2.8%;
d. Kalinga: 1.0%, from -1.4%. and
e. Mountain Province: 0.3% from -0.1%.
Meanwhile, Ifugao recorded a deceleration, with its inflation rate slowing from 6.7% in January 2024 to 6.5% in February 2024, while Apayao retained the previous month’s inflation rate of 6.9%.
________________________________________________________________
Note:
CPI and inflation rates by province and selected city are posted on the PSA website (http://openstat.psa.gov.ph).
(SGD)
VILLAFE P. ALIBUYOG
Regional Director
AFRB/NLP
