

Figure 1: Inflation Rate for the All Income Household and Bottom 30% Income
Household in CAR (2018=100): January 2019 - December 2023
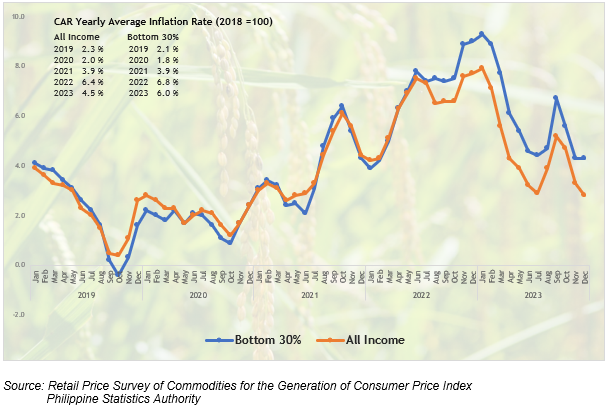
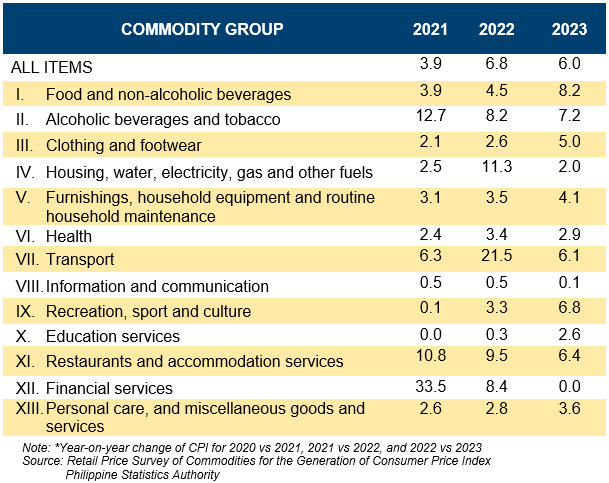
Table A: Annual Inflation Rates for Bottom 30% Income Households by Commodity Group in CAR: 2021-2023
In Percent (2018=100)
- Cordillera Administrative Region (CAR)
The inflation rate for households in the Bottom 30% income bracket in the Cordillera region reached 4.3% in December 2023, resulting in a year-to-date inflation of 6.0%. This is 1.5 percentage points higher than the All Income inflation rate of 4.5%. In 2022, inflation for the Bottom 30% was higher with 6.8%.
As illustrated in the graph, the divergence in inflation became apparent in June 2022 and has persisted since, primarily driven by elevated prices of rice and other food items in the country. However, in 2019, a contrasting trend occurred as the Bottom 30 percent of income households experienced a drop, entering deflation territory. This was also linked to rice and other food items due to lower prices during that period (Figure 1).
1.1 Main Drivers to the 2023 Bottom 30% Income Household Inflation Downward Trend
The downward trend was primarily driven by the Housing, Water, Electricity, Gas and Other Fuels index, with 2.0% from 11.3% in 2022. This was followed by the Transport index with 6.1% from 21.5% in 2022 (Table A, and Figure 1).
Other commodity groups that contributed to the slower annual growth during the year include:
a. Alcoholic Beverages and Tobacco, 7.2% from 8.2%;
b. Health, 2.9% from 3.4%;
c. Information and Communication, 0.1% from 0.5%;
d. Restaurants and Accommodation Services, 6.4% from 9.5% and
e. Financial Services, 0.0% from 8.4%.
In contrast, the following commodity groups registered higher inflation rates:
a. Food and Non-alcoholic Beverages, 8.2% from 4.5%;
b. Clothing and Footwear, 5.0% from 2.6%;
c. Furnishings, Household Equipment and Routine Household Maintenance, 4.1% from 3.5%;
d. Recreation, Sport and Culture, 6.8% from 3.3%;
e. Educational Services, 2.6% from 0.3%; and
f. Personal Care, and Miscellaneous Goods and Services, 3.6% from 2.8%.
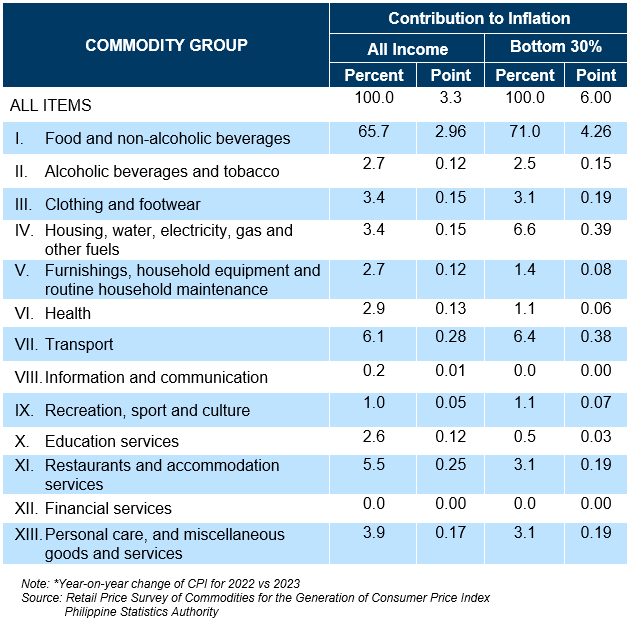
1.2 Main Contributors to the 2023 Inflation in Bottom 30% Income Households
In terms of contribution to the 2023 Bottom 30% Income Household Inflation, the commodity groups with the highest contribution were the following:
a. Food and Non-alcoholic Beverages, with 71.0% share or 4.2 percentage points;
b. Housing, Water, Electricity, Gas and Other Fuels, with 6.6% share or 0.3 percentage points; and
c. Transport, with 6.4% share or 0.3 percentage points.
Table B: 2023 Contribution to Inflation by Commodity Group for the All Income Household and Bottom 30% Income Household in CAR
In Percent (2018=100)
- Food Inflation
Food inflation for households in the Bottom 30% Income bracket in the Cordillera region continued to rise, increasing from 4.6% in 2022 to 8.4% in 2023. For All-income households, the food inflation rate was slightly higher at 8.5% (Table C).
Table C: Food Inflation Rates for the All Income Household and Bottom 30%
Income Household in CAR
In Percent (2018=100)

2.1 Main Drivers of the Upward Trend in Food Inflation
The primary driver of the acceleration of food inflation was the higher annual growth in the index of Vegetables, Tubers, Plantains, Cooking Bananas, and Pulses, which increased to 23.4% from 5.6% in 2022. This was followed by Cereals and Cereal Products, with a growth of 6.6% from 3.1%, and Milk, Other Dairy Products, and Eggs, which rose to 13.8% from 3.2% in 2022.
In addition to these, higher inflation rates were noted in the indices of the following food items:
a. Flour, Bread and Other Bakery Products, Pasta Products, and Other Cereals, 7.2% from 5.2%;
b. Fish and Other Seafood, 5.6% from 4.7%;
c. Fruits and Nuts, 6.6% from 4.2%;
d. Sugar, Confectionery and Desserts, 24.6% from 21.7%; and
e. Ready-made Food and Other Food Products n.e.c., 3.9% from 1.6%.
On the other hand, two food items registered lower annual growth rates: Meat and Other Parts of Slaughtered Land Animals with 1.4% down from 5.7%, and Oils and Fats at 3.3%, down from 8.5% in 2022.
2.2 Main Contributors to Food Inflation
In terms of the contribution to the overall inflation for the Bottom 30% income group in 2023, food constituted 69.3% or 4.16 percentage points. Within the category of food groups, the primary contributors to food inflation were as follows:
a. Cereals and Cereal Products, 38.4% share or 3.2 percentage points;
b. Vegetables, Tubers, Plantains, Cooking Bananas and Pulses, 29.6% share or 2.4 percentage points; and
c. Milk, Other Dairy Products and Eggs, 8.8% share or 0.7 percentage points.
3. Provinces/ Highly Urbanized City (HUC) in CAR
Several provinces and Baguio City showcased a deceleration in their inflation rates, Benguet, in particular, experienced the most significant deceleration, witnessing a noteworthy 3.4 percentage points decrease. Its inflation rate, which stood at 9.1% in 2022, eased to 5.7% in 2023. Following closely, Mountain Province demonstrated a commendable 2.5 percentage points decrease, from 7.2% in 2022 to 4.7% in 2023 (Table D).
Table D: Inflation Rates by Province/City in CAR, All Items
Bottom 30% 2022-2023 and All Income 2023
In Percent (2018=100)
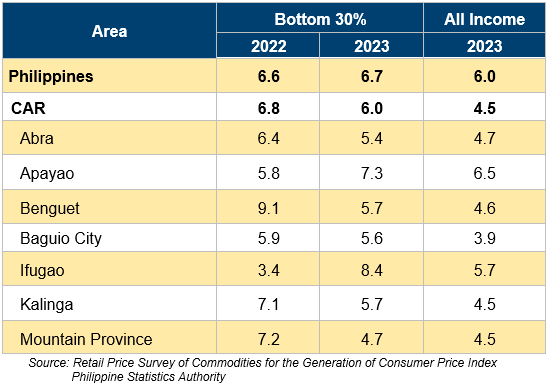
Moreover, the following provinces and city recorded slower inflation rates in 2023:
a. Kalinga, 1.4 percentage points decrease from 7.1% to 5.7%;
b. Abra, percentage points decrease from 6.4% to 5.4%; and
c. Baguio City, 0.3 percentage points decrease from 5.9% to 5.6%.
Conversely, Ifugao and Apayao observed an increase in their inflation rates. Ifugao's inflation rate rose to 8.4% in 2023, registering a 5.0 percentage points increase from 3.4% in 2022. Apayao recorded 7.3% inflation rate in 2023, 1.5 percentage points increase from the 5.8% reported in 2022. Among these provinces, Ifugao reported the highest inflation rate with 8.4%, followed by Apayao with 7.3% and Kalinga with 5.7%.
Note: CPI and inflation rates by province and selected city are posted on the PSA website (http://openstat.psa.gov.ph).
(SGD)
VILLAFE P. ALIBUYOG
Regional Director
AFRB/NLP
_________________________
Technical Notes
Concepts and Definitions of Terms
Base Period a reference period, usually a year, at which the index number is set to 100. It is the reference point of the index number series.
Consumer Price Index (CPI) is an indicator of the change in the average retail prices of a fixed basket of goods and services commonly purchased by an average Filipino household. It shows how much on average, prices of goods and services have increased or decreased from a particular reference period known as base year.
Inflation Rate refers to the annual rate of change or the year-on-year change of the CPI expressed in percent. Inflation is interpreted in terms of the declining purchasing power of money.
Market Basket for CPI purposes, market basket is a term used to refer to a sample of goods and services that are commonly purchased and bought by an average Filipino household.
Philippine Classification of Individual Consumption According to Purpose (PCOICOP) A detailed classification of individual consumption expenditures on goods and services incurred by the three (household, general government, non-profit institutions serving households) of the five institutional sectors (non-financial corporations, financial corporations) of the 1993 and 2008 Systems of National Accounts (SNA). The PCOICOP was patterned after the United Nations COICOP.
Purchasing Power of the Peso (PPP) shows how much the peso in the base period is worth in the current period. It is computed as the reciprocal of the CPI for the period under review multiplied by 100.
Weight is a value attached to a commodity or group of commodities to indicate the relative importance of that commodity or group of commodities in the market basket.
