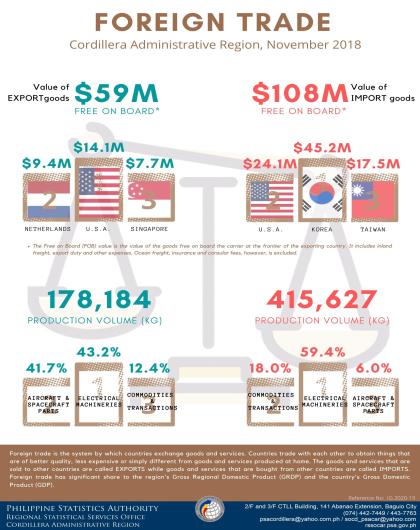
Foreign Trade: Exports
- The Cordillera Administrative Region (CAR) free on board (FOB) value of export goods in October 2016 amounted to $108,386,891. The FOB value decreased by 12.7% from the amount of $124,168,740 last September 2016, and decreased by 8.4% from the $118,358,552 FOB value of exports last August 2016.
- The region’s total production volume of export goods for October 2016 was 188,011 kilograms (kg.). This decreased by 6.0% from the recorded 199,974 kg. production last September 2016, and decreased by 6.1% from the production volume of 200,207 kg. last August 2016.
Exports by Commodity
- Machinery and mechanical appliances, electrical equipment, parts thereof, sound recorders and reproducers, and parts and accessories of such articles remained as the top export commodities sharing 77.9% of the total export sales, which was equivalent to $84,473,332 in export receipts. These goods shared 76.8% in the total regional exports last September 2016 which were valued at $95,356,083.
- Vehicles, aircrafts, vessels and associated transport equipment amounting to $23,560,931 FOB value continued to rank second. This accounted for 21.7% in export sales in October 2016. The share was 22.7% or equivalent to $28,234,071 FOB value last September 2016.
- Raw hides and skins, leather, fur skins and articles thereof; saddlery and harness; travel goods, handbags and similar containers; articles of animal gut (other than silkworm gut) ranked third contributing 0.2% in export sales or equivalent to $257,182 for October 2016. Export sales of this commodity last September 2016 was $141,490 and had a 0.1% share in the total regional exports.
- Exports for miscellaneous manufactured articles for the month of October 2016 was valued at $1,454 FOB value. This commodity incurred zero sales last month.
- Singapore remained to be the top destination of export goods accounting 41.0% share of the total. The exports consisted of machineries and mechanical appliances, electrical equipment, parts thereof, sound recorders and reproducers, and parts and accessories of such articles with total receipts of $34,614,618.
- The Netherlands was the second major destination of export goods at 28.8% share and export sales valued at $24,315,188.
- The region also exported machineries and mechanical appliances to the United States of America ($4,732,385), Taiwan ($4,356,992), Hong Kong ($3,501,966), People’s Republic of China ($8,304,473), Japan ($2,597,452), Thailand ($161,078), Malaysia ($125,906), UK of Great Britain and N. Ireland ($669,410), Mexico ($124,915), Germany ($73,404), India ($572), Republic of Korea ($318,119), Canada ($55,733), France ($492,868), Norway ($24,954), and Brazil ($3,299).
Country of Destination
- The region largely exported to Singapore, The Netherlands, and United States of America in October 2016. Singapore had the biggest share of the region’s exports at 32.6% with total value of $35,286,893. It was followed by The Netherlands with 22.5% share of total exports or equivalent to $24,347,908, and the United States of America with 15.3% share valued at $16,627,701.
- China had a total share of 7.8% ($8,459,452), Japan with 4.8% ($5,216,822), France with 4.7% ($5,109,419), Taiwan with 4.3% ($4,647,233), Hong Kong with 3.3% ($3,538,438), UK of Great Britain and North Ireland with 2.0% ($2,191,470), and Germany with 1.4% ($1,528,814).
- The region also exported goods worth $1,432,741 accounting 1.3% of the total regional exports sales receipts to Australia, Belgium, Brazil, Canada, India, Israel, Italy, Japan, Republic of Korea, Malaysia, Mexico, Netherlands, Norway, Portugal, Saudi Arabia, Spain, Switzerland, Thailand, and United Arab Emirates.
- The Asia-Pacific Economic Cooperation (APEC) member countries are the primary foreign trading partners of the region. APEC is composed of 21 member countries, namely: Australia, Brunei Darussalam, Canada, Chile, People’s Republic of China, Hong Kong, Indonesia, Japan, Republic of Korea, Malaysia, Mexico, New Zealand, Papua New Guinea, Peru, Philippines, Russia, Singapore, Taiwan, Thailand, United States of America, and Vietnam.
- The region recorded 69.1% share of total exports receipts from APEC countries in October 2016 amounting to $74,903,015; while exports to non-APEC countries registered 30.9% with $33,483,876 exports value.
- Singapore remained as the region’s top buyer of export goods among the APEC member countries with sales receipts registering 47.1%, followed by the United State of America at 22.2%, People’s Republic of China at 11.3%, Japan at 7.0%, Taiwan at 6.2%, Hong Kong at 4.7%, and other APEC countries at 1.5%
Technical Notes
Free on Board Value (FOB) - is the value of the goods free on board the carrier at the frontier of the exporting country. It includes inland freight, export duty and other expenses. In addition, the value of goods in the Philippine foreign trade statistics is FOB.
Country of Destination (Exports only) - it is the country where the goods are to be consumed, further processed, or manufactured.
Country of Origin (Imports only) - it is the country where the goods are mined, grown, or manufactured or where each foreign material used or incorporated in a good underwent a change in tariff classification indicating a substantial transformation under the applicable rule of origin for the good.
Exports - the goods and services that are sold to other countries.
Imports - the goods and services that a country buys from other countries.
PSCC (Philippine Standard Commodity Classification) - is used to classify the imported commodities at the most detailed level for statistical purposes.


