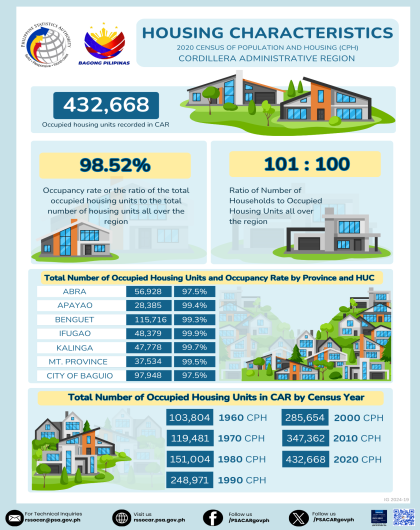
- In Cordillera Administrative Region (CAR), the occupied housing units increased by 12.5% from 347,362 occupied housing units in 2010 to 390,923 occupied housing units in 2015.
- Among the provinces of CAR, Benguet had the most occupied housing units with 106,117 or 27.2% share followed by Baguio City with 87,731 or 22.4% share and Abra with 51,593 or 13.2% share.
- Apayao had the least occupied housing units with 25,418 or 6.5%, Mt. Province with 31,857 or 8.9% and Kalinga with 41,990 or 10.7%.
Table 1. Occupied Housing Units by Province/Highly Urbanized City, CAR: 1990 – 2015
There are 101 households per 100 occupied housing units in CAR
- A total of 395,748 households were recorded in CAR in 2015. The household to occupied housing unit ratio was at 1.0%. This means that there were 101 households in every 100 occupied housing unit.
-
Abra and Baguio City had the highest household to housing unit ratio with 103 households per 100 occupied housing unit. The lowest ratio was recorded both in Ifugao and Kalinga with 100 household per 100 occupied housing unit.
-
The number of persons per occupied housing unit in CAR was recorded at 4 persons per occupied housing unit.
-
Kalinga had the most persons per occupied housing at 5 persons per occupied housing unit. The least was recorded in Baguio City at about 4 persons per occupied housing unit.
Majority of the occupied housing unit in CAR are single houses
- Single house type of housing units made up three-fourths (75.8%) of the total occupied housing units in CAR; 16.0% were multi-unit residential; 7.7% were duplex houses; and only 0.4% were other housing unit. Other housing units includes those in commercial, industrial, agricultural building, institutional living quarters and others.
- In CAR, there were 3 single occupied housing in every 4 occupied housing unit.
Figure 1. Occupied Housing Unit by Type of Building, CAR: 2015
Most occupied housing units in CAR are with outer walls and roofs made of strong materials
- The most common materials used for the roof and walls in CAR were made of strong materials. Strong materials for outer walls refer to concrete, brick, stone, and wood or a combination of these, while light materials refer to bamboo, sawali, cogon, and nipa. For roofs, strong materials include galvanized iron, aluminum, tile, concrete, and clay tile or a combination of these, while light roofing materials refers to bamboo, sawali, cogon, and nipa.
-
Out of the 390,923 occupied housing in CAR, 183,328 or 46.9% occupied housing units had outer walls that were made of concrete/brick/stone. Meaning, for every 10 occupied housing units, there were about 5 occupied housing units with outer walls which were made of concrete/brick/stone.
-
Occupied housing units in CAR with roofs of galvanized iron/aluminum were recorded at 352,666 or 90.1% of the total or for every 10 occupied housing units, 9 occupied housing units had roofs which were made of galvanized iron/aluminum.
Most households in CAR live in house and lot that they owned or amortized
- In 2015, 270,464 or 68.4% of the region’s 395,748 households owned or had owner-like possession of the house and lot that they occupied. Moreover, 14.6% of the households rented the house/room including the lot that they occupied; 9.2% occupied rent-free house and lot with consent of owner and 6.5% percent own house which were rent-free and with the consent of the owner.
Table 4. Number of Households by Tenure Status of the Housing Unit/Lot, CAR: 2015
9 in 10 households use electricity for lighting
- A total 360,533 households or 91.1% of the region’s 395,748 households used electricity for lighting in 2015, up by 9.3 percentage points from 81.8% in 2010. This was followed by kerosene (Gaas) and Others with 5.0% and 1.5 percent, respectively.
-
In CAR, there were 1.4% and 0.8% of households who used solar panel and solar lamp for their lighting.
-
In 2015, proportion of households with no lighting improved by 0.06 percentage points from 285 households or 0.08 percent in 2010 to 93 households or 0.02 percent in 2015.
Most common source of water for drinking is bottled water
- In 2015, 33.9% of households’ main source of water for drinking in the region was bottled water. This was followed by protected spring at 21.6% and Unprotected Spring at 10.7 %.
-
Community water system was the main source of water for cooking by nearly 4 in every 10 households (38.9%). The majority of these households were using their own faucet with 29.8%, while 9.2% percent were using shared faucet with other households.
-
Protected springs were the second main source of water for cooking in the region. There were about 2 households in every 10 that uses protected springs as their source of water supply for cooking.
Technical Notes


