

-
In the 2016 Gross Regional Domestic Product (GRDP) of CAR, Agriculture, Hunting, Forestry and Fishing (AHFF) contributed 8.8 percent to the total regional economy (at constant 2000 prices)
Figure 1. Percent Distribution of Value of Production
by Industry at Constant Price,
Gross Regional Domestic Product, CAR: 2016
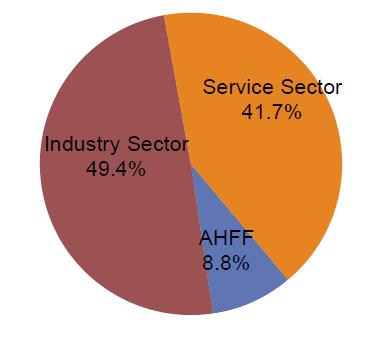
Source: Philippine Statistics Authority
Figure 2. Percent Distribution of Value of Production
in Agriculture at Constant Prices, CAR: 2016
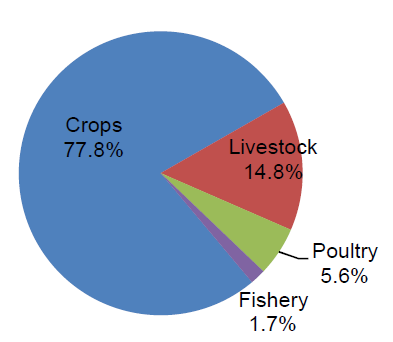
Source: Philippine Statistics Authority
-
Of the total AHFF, the crops sub-sector contributed the biggest share at 77.9 percent, followed by livestock and poultry with 14.8 and 5.6 percent, respectively. Fishery subsector had the least share with 1.7 percent contribution (Figure 2).
Figure 3. Livestock Production (MT), CAR:
January-December 2014-2016
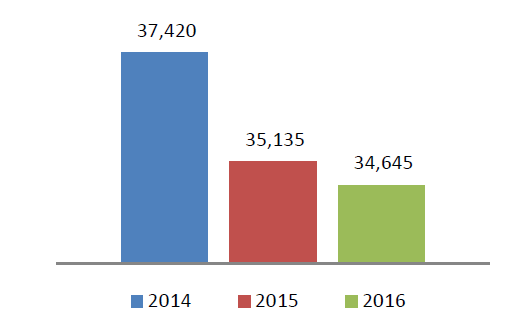
- From 2014 to 2016, total livestock production continuously declined from 37,420 metric tons in 2014 to 34,645 metric tons in 2016 (Figure 3).
LIVESTOCK PRODUCTION
-
Among the four animal types classified under livestock sub-sector, hog production yielded the highest with 26,361 metric tons. This was followed by cattle with 4,333 metric tonsand carabao with 3,105 metric tons. Goat production was estimated at 845 metric tons (Table 1).
| Region/Province | Carabao | Cattle | Hog | Goat | ||||
|---|---|---|---|---|---|---|---|---|
| 2015 | 2016 | 2015 | 2016 | 2015 | 2016 | 2015 | 2016 | |
| CAR | 3,146 | 3,105 | 4,429 | 4,333 | 26,747 | 26,361 | 813 | 345 |
| Abra | 1,073 | 1,131 | 1,703 | 1,681 | 6,355 | 5,968 | 483 | 493 |
| Apayao | 571 | 543 | 273 | 242 | 3,465 | 3,554 | 50 | 47 |
| Benguet | 448 | 396 | 710 | 647 | 2,943 | 3,415 | 132 | 126 |
| Ifugao | 500 | 489 | 800 | 819 | 4,290 | 3,758 | 80 | 85 |
| Kalinga | 392 | 380 | 654 | 681 | 6,086 | 6,209 | 58 | 85 |
| Mountain Province | 162 | 166 | 289 | 263 | 3,608 | 3,457 | 10 | 9 |
Carabao
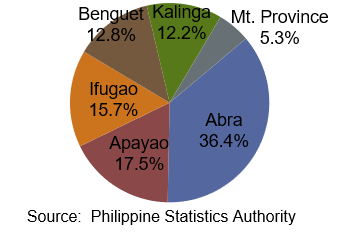
The region’s total carabao production in 2016 was 3,105 metric tons, 1.3 percent lower than last year’s output of 3,146 metric tons (Table 1). Highest production was reported in the province of Abra with a share of 36.4 percent while the lowest production was reported in Mt. Province with 5.3 percent contribution (Figure 4)
Figure 4. Percent Distribution of Carabao Production
by Province, CAR: January-December 2016
Cattle
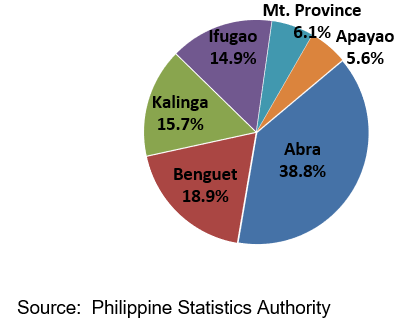
In 2016, cattle production in CAR was estimated at 4,333 metric tons, a drop of 2.2 percent from 4,429 metric tons in 2015 (Table 1). The province of Abra had the biggest share in the overall production at 38.8 percent, followed by Benguet at 18.9 percent and Kalinga at 15.7 percent. Mt. Province and Apayao contributed 6.1 percent and 5.6 percent, respectively (Figure 5).
Figure 5. Percent Distribution of Cattle Production,
by Province, CAR, January--December 201
Hog
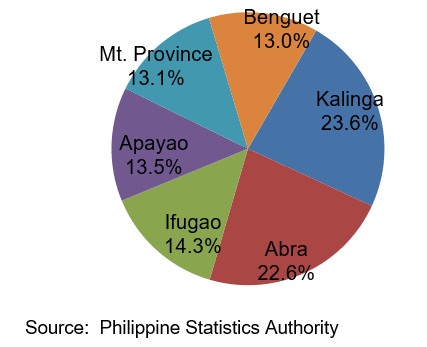
Hog production in 2016 decreased compared to previous year’s level. Production dropped from 26,747 metric tons in 2015 to 26,361 metric tons in 2016 (Table 1). Kalinga was the biggest contributor to hog production with a share of 23.6 percent and closely followed by Abra with 22.6 percent share. Ifugao, Apayao, Mt. Province and Benguet’s share ranged from 13.0 percent to 14.3 percent (Figure 6).
Figure 6. Percent Distribution of Hog Production
by Province, CAR: January-December 2016
Goat
Goat production increased from 813 metric tons in 2015 to 845 metric tons in 2016 or an increment of 3.9 percent (Table 1). More than half of the total goat production in the region was produced by the province of Abra (58.3 percent). Production of other CAR provinces were recorded as follows: Benguet 14.9 percent, Ifugao and Kalinga both had a share of 10.1 percent, Apayao 5.6 percent and Mt. Province 1.1 percent (Figure 7).
Figure 7. Percent Distribution of Goat Production,
by Province, CAR: January-December 2016

LIVESTOCK INVENTORY
Table 2. Livestock Inventory by Animal Type by Province, CAR:
As of January 1, 2016 and 2017
| Region/Province | As of January 1 (in number of heads) | |||||||
|---|---|---|---|---|---|---|---|---|
| Carabao | Cattle | Hog | Goat | |||||
| 2016 | 2017 | 2016 | 2017 | 2016 | 2017 | 2016 | 2017 | |
| CAR | 86,265 | 86,509 | 60,364 | 59,213 | 198,375 | 188,937 | 68,287 | 63,035 |
| Abra | 34,770 | 33,320 | 21,631 | 20,954 | 24,385 | 16,498 | 36,855 | 32,416 |
| Apayao | 13,014 | 13,216 | 2,974 | 3,014 | 26,680 | 26,924 | 3,742 | 3,801 |
| Benguet | 11,300 | 11,806 | 6,238 | 5,994 | 31,294 | 29,492 | 11,550 | 10,794 |
| Ifugao | 7,643 | 7,668 | 11,670 | 11,248 | 26,033 | 23,680 | 7,032 | 7,226 |
| Kalinga | 13,699 | 14,879 | 9,747 | 10,236 | 55,209 | 58,609 | 8,072 | 7,776 |
| Mountain Province | 5,839 | 5,620 | 8,104 | 7,767 | 34,774 | 33,734 | 1,036 | 1,022 |
Figure 8. Percentage Distribution of Livestock Inventory by Animal Type, CAR: As of January 1, 2017
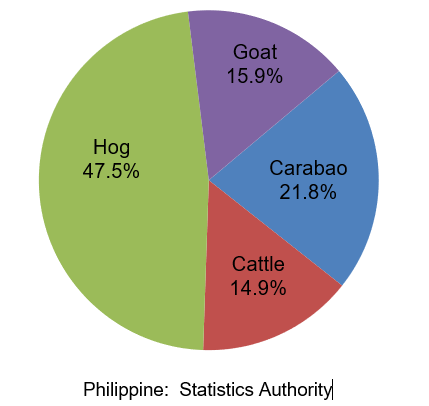
- Of the total livestock inventory as of January 1, 2017, about 47.5 percent consists of hog or swine, 21.8 percent carabao, 15.9 percent goat and 14.9 percent cattle (Figure 8).
Figure 9. Inventory of Carabao (in head) by Farm Type,
CAR: As of January 1, 2016 and 2017
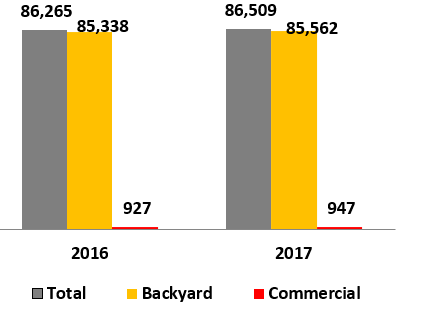
Source: Philippine Statistics Authority
- The total carabao inventory in CAR was 86,509 heads. It decreased by 0.3 percent compared with the stocks of the same period the previous year. Commercial stocks went up by 2.2 percent, while inventory in backyard farms slightly increased by 0.3 percent compared with the previous year’s inventory (Figure 9).
Figure 10. Inventory of Cattle (in head) by Farm Type,
CAR: As of January 1, 2016 and 2017
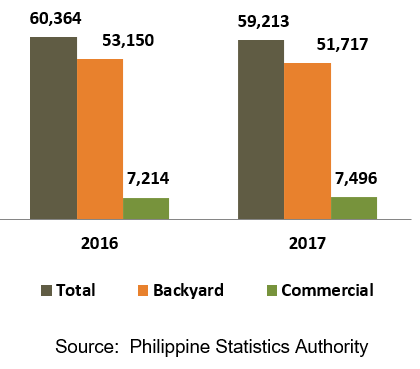
- The total cattle inventory in CAR was estimated at 59,213 heads. About 87.3 percent or 51,717 heads were raised in backyard farms while the remaining 12.7 percent or 7,496 heads were found in commercial farms. Inventory on backyard farms as of January 1, 2017 decreased by 2.7 percent compared with previous year’s stocks (from 53,150 heads to 51,717 heads). However, cattle inventory in commercial farms at 7,496 heads increased by 3.9 percent compared with previous year’s count of 7,214 heads (Figure 10)

- The total swine population stood at 188,937 heads. This was 4.8 percent lower compared with previous year’s inventory of 198.375 heads. About 64.0 percent of the total stocks were raised in backyard farms and the rest were in commercial farms.
Figure 12. Inventory of Goat by Farm Type,
CAR: As of January 1, 2016 and 2017
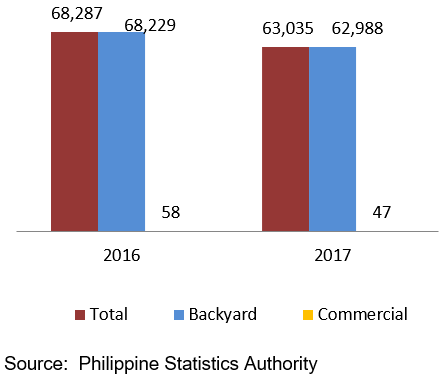
- Total inventory of goat was 63,035 heads. It went down by 7.7 percent from the previous year’s inventory of 68,287 heads. Almost 99.9 percent of the total goat population were raised in backyard farms while only 0.01 percent were raised in commercial farms.
Technical Notes
Livestock - refers to farm animals kept or raised for consumption, work or leisure. In general, poultry is separated as a distinct group of farm animals. For purposes of censuses and surveys, livestock covers only those that are tended and raised by an operator.
Production -refers to the volume of indigenous (locally-raised) animals disposed for slaughter plus animals exported or shipped-out for slaughter both in liveweight equivalent.
Inventory – the actual number domesticated animals present in the farm as of a specific reference date.
Backyard Farm – any farm or household whether farming or non-farming raising at least one head of animal and does not qualify as a commercial farm.
Commercial Farm – any farm or household whether farming or non-farming raising livestock which satisfy the following conditions:
- Tending at least 21 heads of adult and zero head of young
- Tending at least 41 head of young animals
- Tending at least 10 heads of adult and 22 heads of young
