

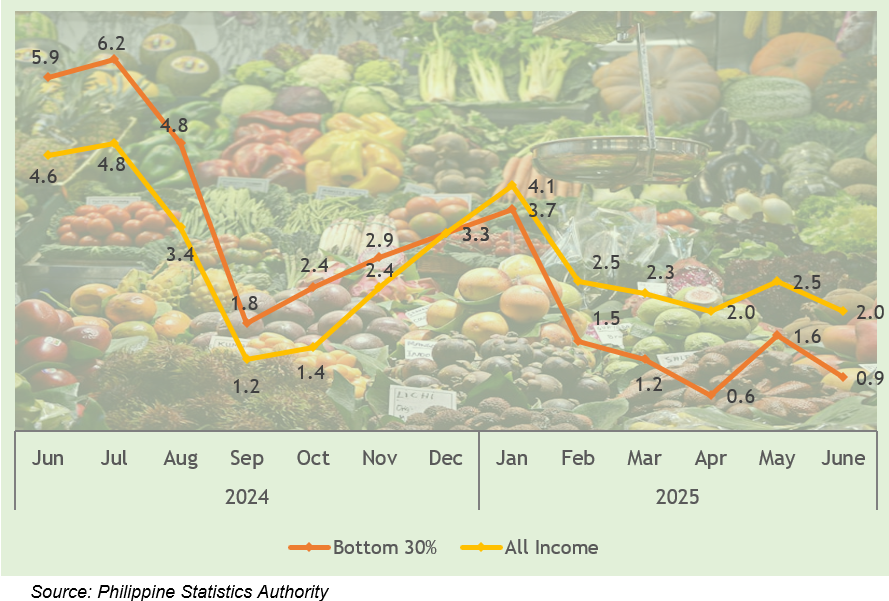
Figure 1. Inflation Rate for the All Income and Bottom 30 Percent Income Households
in CAR, All Items: In Percent
June 2024 - June 2025 (2018=100)
1. Cordillera Administrative Region
In June 2025, the inflation rate for the bottom 30 percent income households in CAR, decelerated to 0.9 percent, from 1.6 percent in May 2025. Except for May 2025 which recorded an increase from its previous month, the inflation rate for both all income households and the bottom 30 percent income households in 2025 showed a consistent decline (Table 1 and Figure 1).
1.1 Main Driver to the Downward Trend of Inflation
The downward trend in inflation was largely driven by the price movement in Food and Non-Alcoholic Beverages commodity group that recorded an inflation rate of 0.2 percent in June 2025, from 1.2 percent inflation in May 2025. This commodity group contributed 66.5 percent to the downtrend in inflation of the region’s bottom 30 percent income households (Table 1 and Figure 1).
Table 1. Year-on-Year Inflation Rates for Bottom 30 Percent Income Households
by Commodity Group in CAR, All Items: In Percent
June 2024, May 2025, June 2025
(2018=100)
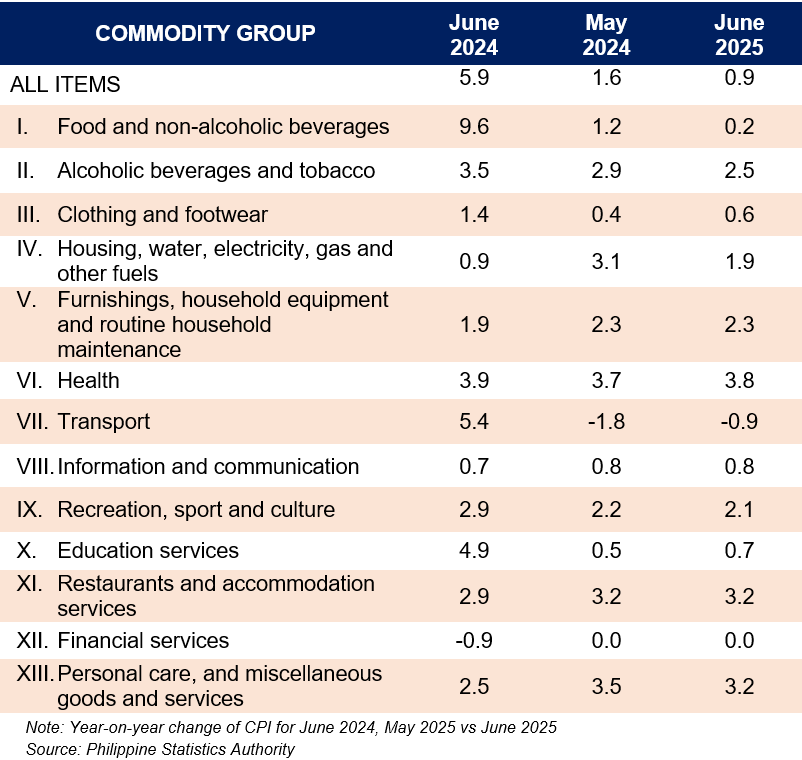
The following also contributed to the decelerated inflation in the region’s bottom 30 percent income households:
a. Alcoholic Beverages and Tobacco, 2.5 percent from 2.9 percent;
b. Housing, Water, Electricity, Gas and Other Fuels, 1.9 percent from 3.1 percent;
c. Recreation Sports and Culture, Education Services, 2.1 percent from 2.2 percent; and
d. Personal Care, and Miscellaneous Goods and Services, 3.2 percent from 3.5 percent.
On the other hand, the following commodity groups recorded faster inflation rates in June 2025 for the bottom 30 percent income households in the region:
Faster inflation rates:
e. Clothing and Footwear, 0.6 percent from 0.4 percent;
f. Health, 3.8 from 3.7 percent; and
g. Education Services, 0.7 from 0.5 percent.
A slower negative inflation rate was recorded for:
h. Transport, -0.9 percent from -1.8 percent.
The inflation rates for the following remained the same from the previous month:
a. Furnishings, Household Equipment and Routine Household Maintenance, 2.3 percent;
b. Information and Communication and Education Services, 0.8 percent;
c. Restaurants and Accommodation Services, 3.2 percent; and
d. Financial Services at 0.0 percent.
1.2 Top Three (3) Contributors to Inflation for the Bottom 30 percent Income Households
The following commodity groups were the top three contributors to the June 2025 overall 0.9 percent inflation rate for the bottom 30 percent income households:
a. Housing, Water, Electricity, Gas and Other Fuels with 38.4 percent share of the total inflation, contributing 0.4 percentage points;
b. Personal Care, and Miscellaneous Goods and Services with 16.5 percent share of the total inflation, contributing 0.2 percentage points to the total 0.9 percent inflation of Cordillera’s bottom 30 percent income household;
c. Food and Non-Alcoholic Beverages with 13.2 percent share of the total inflation, contributing 0.1 percentage points.
2. Food Inflation in CAR
For bottom 30 percent income household in June 2025, food inflation decelerated to 0.2 percent from 1.0 percent in May 2025. This commodity group accounted for 5.8 percent of the total inflation, contributing 0.1 percentage points to the overall inflation rate of 0.9 percent for June 2025. In June 2024, food inflation was recorded at 9.7 percent (Table 2).
2.1 Main Drivers of the Downward Trend in Food Inflation
The decrease in food inflation was primarily driven by faster negative inflation in Rice, that recorded -8.8 percent inflation from -6.9 percent inflation in May 2025. This group contributed 64.8 percent to the deceleration in food inflation for the bottom 30 percent income households in the region (Table 2).
Moreover, slower inflation rates were also observed for the following food items in June 2025:
a. Flour, bread and other bakery products, pasta products, and other cereals, 2.3 percent from 2.5 percent;
b. Meat and Other Parts of Slaughtered Land Animals, 10.5 percent from 10.6 percent;
c. Milk, Other Dairy Products and Eggs, 1.8 percent from 2.1 percent;
d. Vegetables, tubers, plantains, cooking bananas and pulses ice Corn, 1.2 percent from 4.1 percent; and
e. Ready-made food and other food products n.e.c, 5.7 percent from 7.0 percent.
Table 2. Year-on-Year Inflation Rates for Bottom 30 percent Income Households
by Food Group in CAR, All Items: In Percent
June 2024, May 2025-June 2025
(2018=100)
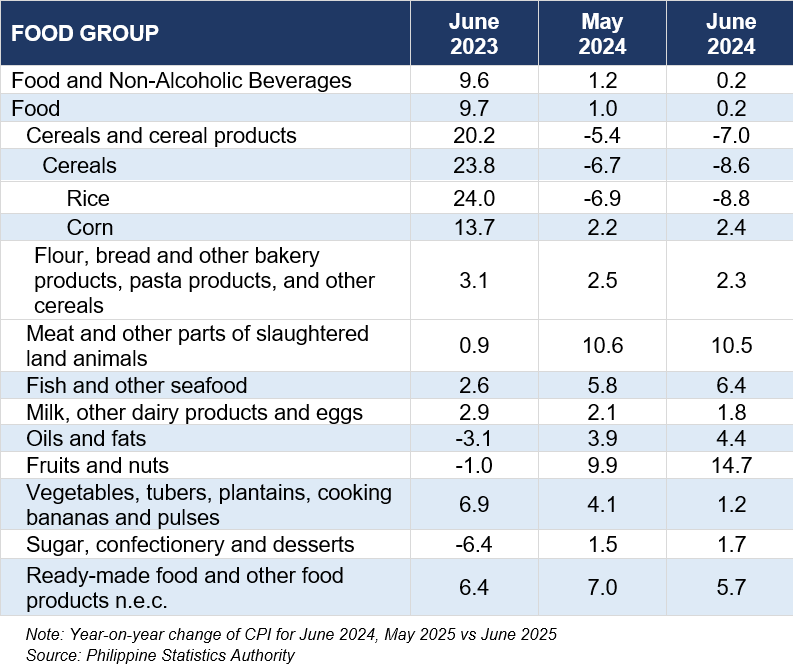
On the other hand, the following food groups recorded faster inflation rates during the reference month:
f. Corn, 2.4 percent from 2.2 percent;
g. Fish and Other Seafood, 6.4 percent from 5.8 percent;
h. Oils and Fats, 4.4 percent from 3.9 percent;
i. Fruits and nuts, 14.7 percent from 9.9 percent; and
j. Sugar, Confectionery and Desserts, 1.7 percent from 1.5 percent.
2.2 Main Contributors to Cordillera Food Inflation
The top three food groups contributing to the 0.2 percent food inflation during the month were:
a. Meat and other parts of slaughtered land animals, 1006.1 percent share, contributing 2.0 percentage points;
b. Fish and other Seafood, 519.7 percent share, contributing 1.0 percentage points; and
c. Fruits and nuts, 435.1 percent share, contributing 0.9 percentage points.
3. Provinces/ Highly Urbanized City -HUC) in CAR
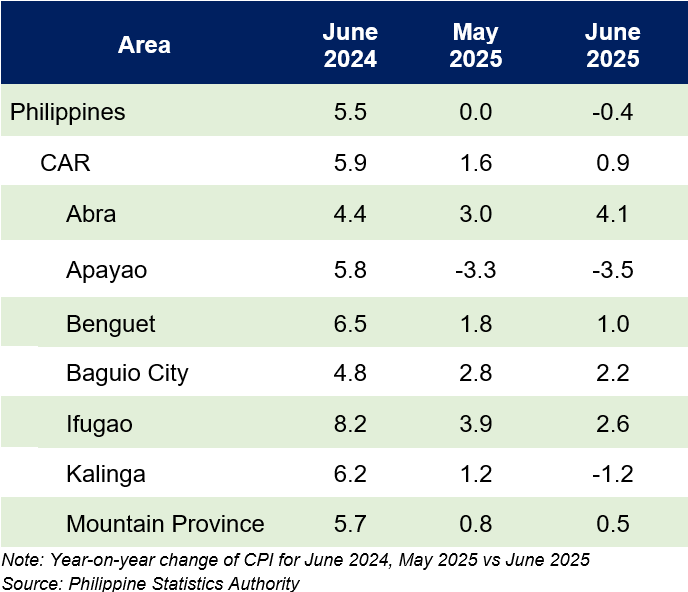
In June 2025, inflation rates for the bottom 30 percent income households were observed to have decelerated across most provinces and the HUC in CAR:
a. Benguet at 1.0 percent from 1.8 percent;
b. Baguio City at 2.2 percent from 2.8 percent;
c. Kalinga at -1.2 percent from 1.2 percent;
d. Ifugao at 2.6 percent from 3.9 percent inflation; and
e. Mountain Province at 0.5 percent from 0.8 percent.
Abra recorded faster inflation at 4.1 percent from 3.0 percent while Apayao posted a faster negative inflation at -3.5 percent from -3.3 percent (Table 3).
Table 3. Year-on-Year Inflation Rates for Bottom 30 percent Income Households
by Province/City in CAR, All Items: In percent
June 2024, May 2025, June 2025
(2018=100)
Note:
Detailed CPI and inflation rate data by province and HUCs are available on the PSA website -http://openstat.psa.gov.ph.
(SGD)
VILLAFE P. ALIBUYOG
Regional Director
Designation Initials Date
CSS AFRB 11 July 2025
SuSS WBM 10July 2025
COSW SCG 08 July 2025
Technical Notes
Base Period a reference period, usually a year, at which the index number is set to 100. It is the reference point of the index number series.
Consumer Price Index -CPI is an indicator of the change in the average retail prices of a fixed basket of goods and services commonly purchased by an average Filipino household. It shows how much on average, prices of goods and services have increased or decreased from a particular reference period known as base year.
Inflation Rate refers to the annual rate of change or the year-on-year change of the CPI expressed in percent. Inflation is interpreted in terms of the declining purchasing power of money.
Market Basket for CPI purposes, market basket is a term used to refer to a sample of goods and services that are commonly purchased and bought by an average Filipino household.
Philippine Classification of Individual Consumption According to Purpose -PCOICOP A detailed classification of individual consumption expenditures on goods and services incurred by the three -household, general government, non-profit institutions serving households of the five institutional sectors -non-financial corporations, financial corporations of the 1993 and 2008 Systems of National Accounts -SNA. The PCOICOP was patterned after the United Nations COICOP.
Purchasing Power of the Peso -PPP shows how much the peso in the base period is worth in the current period. It is computed as the reciprocal of the CPI for the period under review multiplied by 100.
Weight is a value attached to a commodity or group of commodities to indicate the relative importance of that commodity or group of commodities in the market basket.
