

Gross Regional Domestic Product (GRDP) measures the economic performance of a region. It covers the value of goods and services produced in the region.
The GRDP includes the regional estimates on the three-major industry of the economy including their sub-industries. The three major industries are Agriculture, Hunting, Forestry
and Fishing (AHFF), Industry and Services.
The GRDP is presented in nominal and real terms. Nominal GRDP measures the value of the outputs of the economy at current prices while real GRDP or at constant prices measure the
value of economic outputs using the prices of a fixed base year. The GRDP is usually reported in real terms or constant prices since the effects of inflation are removed.
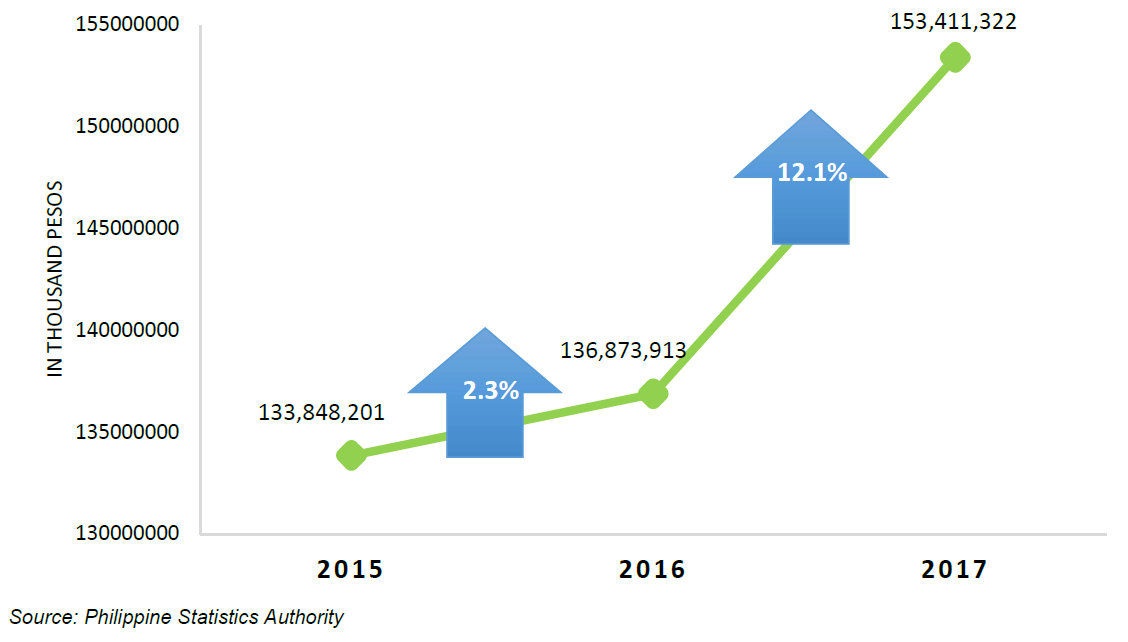
CAR’s economy posts a 12.1 percent growth in 2017
- The economy of the Cordillera Administrative Region (CAR) in 2017 had an estimated Gross Value Added (GVA) of about 153 billion pesos from about 137 billion in 2016 at constant 2000 prices. The economy grew by 12.1 percent year-on-year, an acceleration from the revised growth of 2.3 percent in 2016. The growth in 2017 was the highest in 17 years since posting a 10.8 percent growth rate in year 2000.
Figure 1. CAR GRDP: 2015-2017
(At Constant 2000 Prices, In Thousand Pesos)
Growth rates by major industry/sub-industry
- Agriculture, Hunting, Forestry & Fishing (AHFF) rebounded from negative 4.5 percent in 2016 to positive 5.1 percent in 2016. The turnaround was brought about by the positive growth of Agriculture and Forestry sub-industry from negative 4.8 percent in 2016 to positive 5.2 percent in 2017. On the other hand, Fishing contracted from positive 9.2 percent growth in 2016 to negative 0.2 percent in 2017.
-
Industry turned around from a negative growth of 0.3 percent in 2016 to a positive growth of 18.6 percent in 2017. The accelerated growths of Construction and Manufacturing fueled the double-digit growth rate. Manufacturing, the Industry’s biggest contributor, posted a robust growth of 19.5 percent in 2017 from 3.8 percent the previous year. Construction turned around from negative 26.4 percent in 2016 to positive 23.6 percent in 2017.
-
Services decelerated from 7.1 percent in 2016 to 5.8 percent in 2017. The deceleration was due to the slowdown of Other Services (OS), Transportation, Storage & Communication (TSC) and Financial Intermediation (FI). Other Services slowed down the farthest from 11.1 percent in 2016 to 4.6 percent in 2017 followed by TSC from 6.0 percent to 3.8 percent and Financial Intermediation from 9.1 percent to 9.0 percent. On the other hand, Real Estate, Renting and Business Activities (RERBA) recorded the fastest growth from 3.1 percent to 5.9 percent, followed by Public Administration and Defense (PAD) from 5.2 percent to 5.9 percent and Trade from 7.4 percent to 8.1 percent.
Table 1. GRDP Growth Rates, CAR: 2015-2016 and 2016-2017
(At Constant 2000 Prices)
| INDUSTRY/YEAR | 2015 - 2016 | 2016-2017 |
|---|---|---|
| I. AGRICULTURE, HUNTING, FORESTRY & FISHING | (4.5) | 5.1 |
| a. Agriculture and Forestry | (4.8) | 5.2 |
| b. Fishing | 9.2 | (0.2) |
| II INDUSTRY SECTOR | (0.3) | 18.6 |
| a. Mining and Quarrying | (3.5) | (2.9) |
| b. Manufacturing | 3.8 | 19.5 |
| c. Construction | (26.4) | 23.6 |
| d. Electricity, Gas and Water Supply | 12.6 | 5.7 |
| III SERVICE SECTOR | 7.1 | 5.8 |
| a. Transportation, Storage & Communication | 6.0 | 3.8 |
| b. Trade and Repair of Motor Vehicles, Motorcycles, Personal and Household Goods | 7.4 | 8.1 |
| c. Financial Intermediation | 9.1 | 9.0 |
| d. Real Estate, Renting & Business Activities | 3.1 | 5.9 |
| e. Public Administration & Defense; Compulsory Social Security | 5.2 | 5.9 |
| f. Other Services | 11.1 | 4.6 |
| GROSS REGIONAL DOMESTIC PRODUCT | 2.3 | 12.1 |
Note:Details may not add up to totals due to rounding.
Source: Philippine Statistics Authority
Shares of industries
- The economy of CAR remained to be Industry-driven as it accounted more than half of the region’s total output at 52.1 percent followed by Services at 39.6 percent. AHFF accounted only 8.3 percent of the region’s economy. The percent share of Industry to the total output of the regional economy increased while the shares of Services and AHFF decreased.
-
At the sub-industry level, Manufacturing was still the highest contributor to the regional economy with 43.2 percent share, followed by Other Services in which Education, Health,Hotels and Restaurants are accounted for with 11.1 percent share. RERBA where Business Process Outsourcing (BPOs) are accounted for was the third highest contributor with a share of 9.9 percent in 2017.
Table 2. Percent Distribution by Industry/Sub-industry, CAR: 2016-2017
(At Constant 2000 Prices)
| INDUSTRY/YEAR | 2016 | 2017 |
|---|---|---|
| I. AGRICULTURE, HUNTING, FORESTRY & FISHING | 8.8 | 8.3 |
| a. Agriculture and Forestry | 8.7 | 8.1 |
| b. Fishing | 0.2 | 0.1 |
| II INDUSTRY SECTOR | 49.3 | 52.1 |
| a. Mining and Quarrying | 1.5 | 1.3 |
| b. Manufacturing | 40.5 | 43.2 |
| c. Construction | 5.1 | 5.6 |
| d. Electricity, Gas and Water Supply | 2.1 | 2.0 |
| III SERVICE SECTOR | 41.9 | 39.6 |
| a. Transportation, Storage & Communication | 6.1 | 5.6 |
| b. Trade and Repair of Motor Vehicles, Motorcycles, Personal and Household Goods | 5.7 | 5.5 |
| c. Financial Intermediation | 4.2 | 4.1 |
| d. Real Estate, Renting & Business Activities | 10.4 | 9.9 |
| e. Public Administration & Defense; Compulsory Social Security | 3.6 | 3.5 |
| f. Other Services | 11.9 | 11.1 |
Note:Details may not add up to totals due to rounding.
Source: Philippine Statistics Authority
Sectoral distribution of the major industries
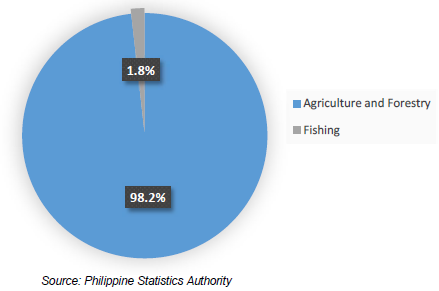
- Of the total 12.7 billion output of AHFF in 2017, Agriculture and Forestry comprised 98.2 percent while Fishing accounted only 1.8 percent.
Figure 2. Percentage Distribution of AHFF, CAR: 2017
(At Constant 2000 Prices)
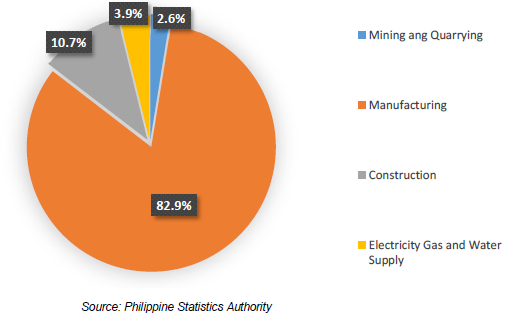
- The driver of the Industry sector was manufacturing with 82.9 percent share to the total 80.0 billion output of the sector. This was followed by Construction with 10.7 percent, Electricity, Gas and Water Supply (EGWS) with 3.9 percent and Mining and Quarrying with 2.6 percent.
Figure 3. Percentage Distribution of Industry CAR : 2017
(At Constant 2000 Prices)
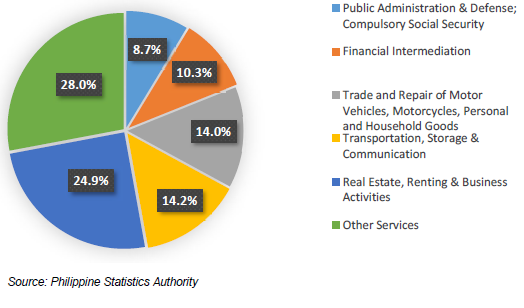
- The biggest contributors to the 60.7 billion output of Services were Other Services and RERBA with 28.0 percent and 24.9 percent shares, respectively. These Service subindustries follow Manufacturing in Industry as the two next biggest contributors to the regional economy. Meanwhile, TSC contributed 14.2 percent, Trade and Repair with 14.0 percent, Financial Intermediation with 10.3 percent and PAD with 8.7 percent.
Figure 4: Percentage Distribution of Services CAR : 201
(At Constant 2000 Prices)
Contribution to growth
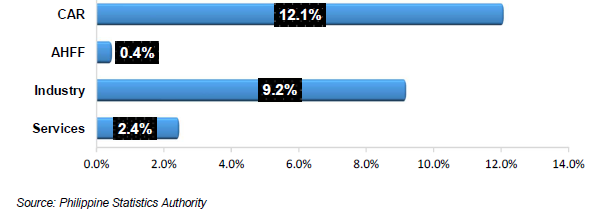
- Industry contributed most to the region’s overall growth rate with 9.2 percentage points. Services added 2.4 percentage points and AHFF contributed the least with 0.4 percentage point.
-
At the sub-industry level, Manufacturing contributed 7.9 percentage points to the region’s growth rate, followed by Construction with 1.2 percentage points and RERBA with 0.6 percentage points.
Figure 5: GRDP Contribution to Growth, CAR: 2017
(At Constant 2000 Prices)
Per capita GRDP
- The per capita GRDP of the region stood at 83,044 pesos in 2017. This was 10.14 percent higher than the 75,401 pesos per capita GRDP posted in 2016. The region’s per capita GRDP was 0.55 percent higher than the national average of 82,592 pesos. NCR had the highest per Capita GRDP with 244,453 pesos, followed by Region 4A (CALABARZON) with 99,328 pesos. CAR was the third highest.
Table 3. Per Capita GRDP and Growth Rate by Region: 2015 to 2017
(At Constant 2000 Prices)
Table 2. Percent Distribution by Industry/Sub-industry, CAR: 2016-2017
(At Constant 2000 Prices)
| REGION / YEAR | REGION / YEAR | Growth Rate | ||
|---|---|---|---|---|
| 2015 | 2016 | 2017 | 16-17 | |
| Philippines | 74,833 | 78,676 | 82,592 | 4.98 |
| NCR | 218,987 | 232,739 | 244,453 | 5.03 |
| CAR | 75,048 | 75,401 | 83,044 | 10.14 |
| 1 ILOCOS | 46,180 | 49,474 | 51,728 | 4.56 |
| 2 CAGAYAN VALLEY | 38,436 | 39,344 | 41,600 | 5.73 |
| 3 CENTRAL LUZON | 63,641 | 68,634 | 73,921 | 7.70 |
| 4A CALABARZON | 92,184 | 94,811 | 99,328 | 4.76 |
| 4B MIMAROPA | 39,575 | 39,784 | 41,421 | 4.11 |
| 5 BICOL | 25,770 | 26,686 | 27,504 | 3.07 |
| 6 WESTERN VISAYAS | 39,653 | 41,417 | 44,296 | 6.95 |
| 7 CENTRAL VISAYAS | 64,846 | 69,315 | 71,677 | 3.41 |
| 8 EASTERN VISAYAS | 33,771 | 37,144 | 37,125 | (0.05) |
| 9 ZAMBOANGA PENINSULA | 41,873 | 43,043 | 43,300 | 0.60 |
| 10 NORTHERN MINDANAO | 60,290 | 63,771 | 66,499 | 4.28 |
| 11 DAVAO REGION | 61,335 | 65,913 | 71,762 | 8.87 |
| 12 SOCCSKSARGEN | 44,178 | 45,459 | 48,240 | 6.12 |
| 13 CARAGA | 35,553 | 35,537 | 36,308 | 2.17 |
| ARMM | 13,646 | 13,366 | 13,989 | 4.66 |
Note:Details may not add up to totals due to rounding.
Source: Philippine Statistics Authority
CAR performance versus other regions
- CAR grew the fastest in 2017 in terms of growth rates with 12.1 percent, 14 ranks higher compared to its rank in 2016, from Rank 15. The last time CAR had a double-digit growth rate was in year 2000 when the regional economy grew by 10.8 percent. Region 11 (Davao Region) followed at 10.9 percent and Region 3 (Central Luzon) at 9.3 percent GRDP growth rate.
-
Of the 6.7 percent gain of the national economy, NCR contributed the most with 2.2 percentage points, followed by CALABARZON and Central Luzon with 1.1 percentage point and 0.8 percentage point contribution, respectively. CAR, on the other hand, ranked 9 out of the 17 regions, 6 ranks higher than in 2016, and contributed 0.204 percentage point to the national economy. Adjoining regions of Ilocos and Cagayan Valley contributed 0.184 and 0.123 percentage points, respectively.
Table 4. GRDP Growth Rate, Rank and Contribution to Growth by Region:
2016 to 2017 (At Constant 2000 Prices)
| AREA | Growth Rate | Rank of Growth Rate | Contribution to Growth | Rank of Contribution to Growth | |||
|---|---|---|---|---|---|---|---|
| 15-16 | 16-17 | 2016 | 2017 | 2016 | 2017 | ||
| Philippines | 6.9 | 6.7 | |||||
| NCR | 7.4 | 6.1 | 7 | 10 | 2.239 | 1 | 1 |
| CAR | 2.3 | 12.1 | 15 | 1 | 0.204 | 15 | 9 |
| 1 ILOCOS | 8.5 | 5.8 | 5 | 12 | 0.184 | 7 | 10 |
| 2 CAGAYAN VALLEY | 3.8 | 7.2 | 13 | 7 | 0.123 | 13 | 11 |
| 3 CENTRAL LUZON | 9.5 | 9.3 | 3 | 3 | 0.881 | 2 | 3 |
| 4A CALABARZON | 4.8 | 6.7 | 11 | 8 | 1.125 | 3 | 2 |
| 4B MIMAROPA | 2.6 | 6.2 | 14 | 9 | 0.096 | 14 | 13 |
| 5 BICOL | 5.5 | 5.1 | 9 | 14 | 0.102 | 11 | 12 |
| 6 WESTERN VISAYAS | 5.9 | 8.4 | 8 | 4 | 0.336 | 9 | 5 |
| 7 CENTRAL VISAYAS | 8.6 | 5.1 | 4 | 13 | 0.327 | 4 | 6 |
| 8 EASTERN VISAYAS | 12.0 | 1.8 | 1 | 17 | 0.038 | 8 | 17 |
| 9 ZAMBOANGA PENINSULA | 4.6 | 2.3 | 12 | 16 | 0.047 | 12 | 15 |
| 10 NORTHERN MINDANAO | 7.5 | 5.9 | 6 | 11 | 0.222 | 6 | 7 |
| 11 DAVAO REGION | 9.5 | 10.9 | 2 | 2 | 0.448 | 5 | 4 |
| 12 SOCCSKSARGEN | 4.9 | 8.2 | 10 | 5 | 0.214 | 10 | 8 |
| 13 CARAGA | 2.0 | 4.3 | 16 | 15 | 0.052 | 16 | 14 |
| ARMM | 0.4 | 7.3 | 17 | 6 | 0.046 | 17 | 16 |
Note:Details may not add up to totals due to rounding.
Source: Philippine Statistics Authority
TECHNICAL NOTES
Components
The GRDP includes regional estimates on the three major sectors including their sub-sectors namely:
A. Agriculture, Hunting, Forestry and Fishing (AHFF)
a. Agriculture and Forestry
b. Fishing
B. Industry Sector
a. Mining and Quarrying
b. Manufacturing
c. Construction
d. Electricity, Gas and Water Supply (EGWS)
C. Service Sector
a. Transport, Storage and Communication (TSC)
b. Trade and Repair of Motor Vehicles, Motorcycles, Personal and Household Goods
c. Financial Intermediation (FI)
d. Real Estate, Renting and Business Activity (RERBA)
e. Public Administration and Defense; Compulsory Social Security (PAD)
f. Other Services (OS)
Considerations
In using the GRDP, the following points should be considered:
The following sub-industries (Manufacturing, TSC, RERBA, Trade and OS) are based on the Census of Philippine Business and Industry (CPBI) and Annual Survey of Philippine Business and Industry (ASPBI) results from PSA, which becomes available every two (2) years after the reference year. During the years when the CPBI or ASPBI results are not yet available, other indicators and the Quarterly Survey of Philippine Business and Industry (QSPBI) trend are used to produce regional GVA estimates. In the case of the TSC, subsequent adjustments are made based on the additional indicators from administrative data of LTO, PPA, PAL, ATO, and PPC.
The regional GVAs for each of the sub-industries of agriculture, fishery and forestry are estimated indirectly using the gross value-added ratio (GVAR) approach.
For private construction, regional distribution is based on the structure of the Building Permits data. For public construction disaggregation by region is based on the regional breakdown of the infrastructure program of DPWH and validated by the individual agencies' infrastructure programs.
For the sub-industry of electricity and water where available financial statements from NPC, MERALCO, NGCP, MWSS and LWUA can provide the required data inputs, the production approach is employed to estimate the regional GVAs.
The regional distribution of resources from the BSP fact book and Insurance Commission are used to estimate the regional GVAs of the Financial Intermediation sub-sectors.
For RERBA, regional benchmark estimates are obtained using the results of the latest Census of Population and Housing (CPH) and Family Income and Expenditure Survey (FIES). Regional data on the total floor area of residential construction available from Building Permits data of PSA serve as indicator for estimating the regional distribution of the number of occupied dwelling units.
The regional GVAs for the PAD are estimated based on the data from the Commission on Audit (COA)
