

Release Date :
Reference Number :
2024CAR11SR-08-039
Table A. Year-on-Year Inflation Rates, All Items
In percent
(2018=100)
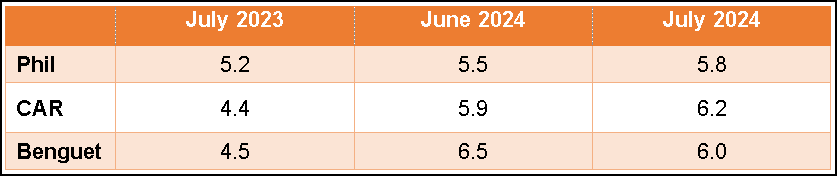
Figure 1. Inflation Rates in CAR, All Items
(2018=100)
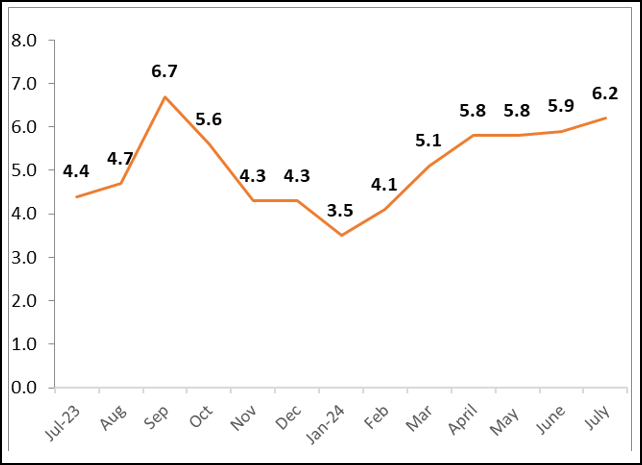
Source: Retail Price Survey of Commodities for the Generation of Consumer Price Index, Philippine Statistics Authority
Figure 2. Inflation Rates in Benguet, All Items
(2018=100)
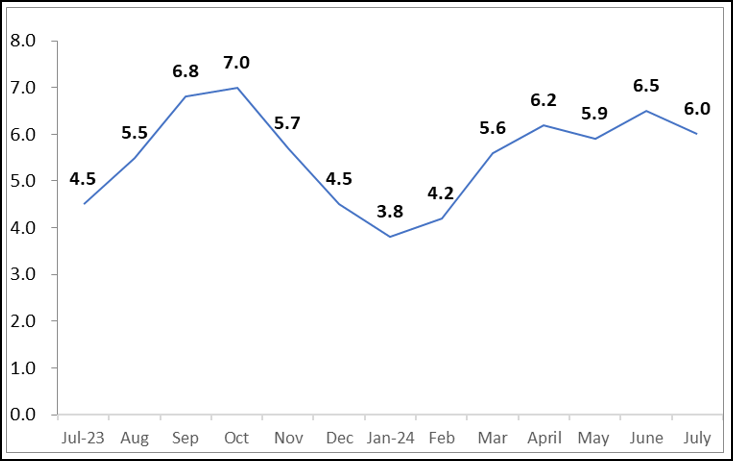
Source: Retail Price Survey of Commodities for the Generation of Consumer Price Index, Philippine Statistics Authority
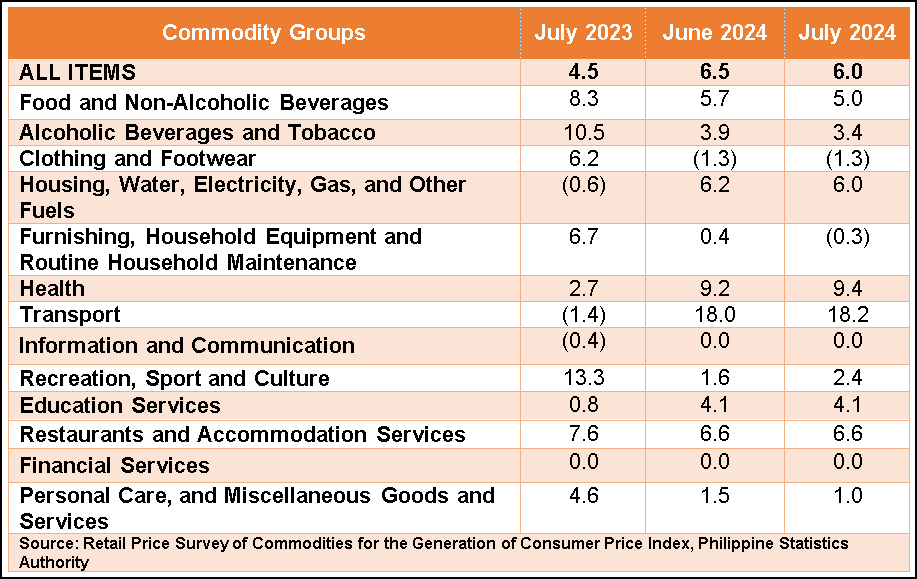
Table B. Year-on-Year Inflation Rates in Benguet
By Commodity Groups
In percent
(2018=100)
Benguet
Inflation in Benguet for the bottom 30% income households decreased to 6.0 percent in July 2024, from 6.5 percent in June 2024. In July 2023, inflation was lower at 4.5 percent. (Table B and Figure 2)
The main contributor of inflation for this income group in July 2024 was food and non-alcoholic beverages at 5.0 percent, from 5.7 percent in the previous month. This was followed by transport at 18.2 percent from 18.0 percent, and housing, water, electricity, gas and other fuels at 6.0 percent, from the 6.2 percent in the previous month. Moreover, the following also decreased during the month:
a. Alcoholic beverages and tobacco, 3.4 percent from 3.9 percent;
b. Furnishings, household equipment and routine household maintenance, -0.3 percent from 0.4 percent; and
c. Personal care, and miscellaneous goods and services, 1.0 percent from 1.5 percent.
On the contrary, increases were recorded on the following:
a. Health, 9.4 percent from 9.2 percent; and
b. Recreation, sport and culture, 2.4 percent from 1.6 percent.
The rest of the commodity groups retained their indices.
Food Inflation
Food inflation for the bottom 30% income households at the provincial level moved at a slower pace of 5.1 percent in July 2024 from 5.9 percent in the previous month. In July 2023, its annual increase was observed at 8.7 percent.
The top contributors to the food inflation were as follows:
a. Vegetables, tubers, plantains, cooking bananas and pulses, -1.0 percent from 8.5 percent;
b. Fish and other seafood, 1.9 percent from 2.6 percent; and
c. Fruits and nuts, -3.4 percent from -2.7 percent.
Decreases were also recorded from the following:
a. Milk, other dairy products and eggs, 2.4 percent from 2.7 percent, and
b. Ready-made food and other food products, 4.4 percent from 5.0 percent.
Meanwhile, increases were recorded from the following:
a. Cereals and cereal products, 13.9 percent from 13.0 percent;
b. Meat and other parts of slaughtered land animals, 0.8 from -1.3 percent;
c. Oils and fats, -3.8 percent from -5.4 percent; and
d. Sugar, confectionery and desserts, -4.2 percent from -4.6 percent.
Note: CPIs and inflation rates by region, province and selected city are posted at the PSA website (https://openstat.psa.gov.ph/).
IMELDA L. BUYUCCAN (SGD)
Chief Statistical Specialist
/SMBP
| Attachment | Size |
|---|---|
|
|
1.76 MB |