

Release Date :
Reference Number :
SSR 2023-48
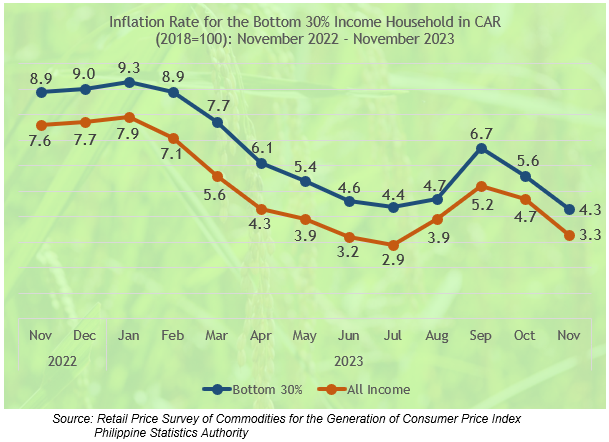
Figure 1: Inflation Rates for Bottom 30% Income Households in Cordillera
Administrative Region, All Items: November 2022 - November 2023
(2018=100)
- Cordillera Administrative Region (CAR)
The inflation rate for households in the bottom 30% income bracket in the Cordillera region eased to 4.3 percent in November 2023 from 5.6 percent in October 2023. However, this remained 1.0 percentage points higher than the overall inflation rate of 3.3 percent. In November 2022, inflation for the bottom 30% was higher at 8.9 percent.
1.1 Three Main Drivers to the Downward Trend of Inflation
The downward trend was primarily driven by the heavily-weighted Food and Non-alcoholic beverages index, which decreased to 8.1 percent from 9.8 percent in October 2023. This was followed by the Transport index at 2.5 percent, down from 3.3 percent in the previous month. Restaurants and accommodation services ranked third with 3.1 percent, down from 4.4 percent in October 2023 (Table A, Table B, and Figure 1).
Table A: Year-on-Year Inflation Rates
for Bottom 30% Income Households by Commodity Group in CAR
In Percent (2018=100)
| COMMODITY GROUP | November 2022 | October 2023 | November 2023 |
| ALL ITEMS | 8.9 | 5.6 | 4.3 |
| I. Food and non-alcoholic beverages | 7.6 | 9.8 | 8.1 |
| II. Alcoholic beverages and tobacco | 10.5 | 5.7 | 4.7 |
| III. Clothing and footwear | 4.8 | 4.0 | 3.0 |
| IV. Housing, water, electricity, gas and other fuels | 11.5 | -2.1 | -2.1 |
| V. Furnishings, household equipment and routine household maintenance | 5.1 | 3.2 | 2.2 |
| VI. Health | 4.1 | 2.5 | 2.7 |
| VII. Transport | 20.3 | 3.3 | 2.5 |
| VIII. Information and communication | 0.2 | 0.1 | 0.1 |
| IX. Recreation, sport and culture | 7.1 | 4.7 | 4.3 |
| X. Education services | 1.3 | 4.9 | 4.9 |
| XI. Restaurants and accommodation services | 11.1 | 4.4 | 3.1 |
| XII. Financial services | 0.0 | 0.0 | 0.0 |
| XIII. Personal care, and miscellaneous goods and services | 4.2 | 2.6 | 2.0 |
Note: *Year-on-year change of CPI for November 2022, October 2023 vs November 2023
Source: Retail Price Survey of Commodities for the Generation of Consumer Price Index
Philippine Statistics Authority
Other commodity groups that contributed to the slower annual growth during the month were:
- Clothing and footwear, 3.0 percent from 4.0 percent;
- Personal care, and miscellaneous goods and services, 2.0 percent from 2.6 percent;
- Alcoholic beverages and tobacco, 4.7 percent from 5.7 percent;
- Furnishings, household equipment and routine household maintenance, 2.2 percent from 3.2 percent; and
- Recreation, sport and culture, 4.3 percent from 4.7 percent.
In contrast, only Health registered a higher inflation rate at 2.7 percent from 2.5 percent in the previous month.
Meanwhile, the inflation of the following commodity groups retained their previous month’s annual growth rates:
- Housing, water, electricity, gas and other fuels, -2.1 percent;
- Information and communication, 0.1 percent;
- Educational services, 4.9 percent; and
- Financial services, 0.0 percent.
1.2 Main Contributors to the Bottom 30% Income Household Inflation
In terms of contribution to the November 2023 inflation rate, the top three commodity groups were the following:
- Food and non-alcoholic beverages, with 92.2 percent share or 3.96 percentage points;
- Transport, with 3.4 percent share or 0.15 percentage points; and
- Clothing and footwear, with 2.5 percent share or 0.11 percentage points.
Meanwhile, the commodity group Housing, water, electricity, gas and other fuels contributed a -9.1 percent share or -0.39 percentage points, to the Bottom 30% November 2023 inflation rate (Table B).
Table B: November 2023 Contribution to Inflation by Division for the
Bottom 30% Income Households in Cordillera
In Percent (2018=100)
| COMMODITY GROUP | Contribution to Inflation | |||
| All Income |
Bottom 30% | |||
| Percent | Point | Percent | Point | |
| ALL ITEMS | 100.0 | 3.3 | 100.0 | 4.3 |
| I. Food and non-alcoholic beverages | 73.0 | 2.41 | 92.2 | 3.96 |
| II. Alcoholic beverages and tobacco | 2.5 | 0.08 | 2.2 | 0.09 |
| III. Clothing and footwear | 3.2 | 0.10 | 2.5 | 0.11 |
| IV. Housing, water, electricity, gas and other fuels | -9.4 | -0.31 | -9.1 | -0.39 |
| V. Furnishings, household equipment and routine household maintenance | 3.5 | 0.12 | 1.0 | 0.04 |
| VI. Health | 4.5 | 0.15 | 1.3 | 0.06 |
| VII. Transport | 1.5 | 0.05 | 3.4 | 0.15 |
| VIII. Information and communication | 0.53 | 0.02 | 0.04 | 0.00 |
| IX. Recreation, sport and culture | 0.9 | 0.03 | 0.9 | 0.04 |
| X. Education services | 9.1 | 0.30 | 1.3 | 0.06 |
| XI. Restaurants and accommodation services | 6.8 | 0.22 | 2.0 | 0.09 |
| XII. Financial services | 0.0 | 0.00 | 0.0 | 0.00 |
| XIII. Personal care, and miscellaneous goods and services | 3.9 | 0.13 | 2.3 | 0.10 |
Note: *Year-on-year change of CPI for November 2022, October 2023 vs November 2023
Source: Retail Price Survey of Commodities for the Generation of Consumer Price Index
Philippine Statistics Authority
- Food Inflation
Food inflation for households in the bottom 30% income bracket in the Cordillera region continued to slow down from 10.1 percent in October 2023 to 8.2 percent in November 2023. In November 2022, the food inflation was lower at 7.8 percent (Table C).
3.1 Main Drivers to the Downward Trend of Food Inflation
The primary driver of the lower food inflation was the lower annual growth in the index of Vegetables, tubers, plantains, cooking bananas and pulses with 12.1 percent from 31.4 percent in October 2023. This was followed by Sugar, confectionery and desserts with -3.5 percent from 2.6 percent, and Fruits and nuts with 8.0 percent from 9.9 percent in the previous month.
Lower inflation rates during the month were also noted in the indices of the following food items:
- Fish and other seafood, 5.1 percent from 5.7 percent; and
- Flour, bread and other bakery products, pasta products, and other cereals, 3.8 percent from 4.4 percent.
Table C: Year-on-Year Inflation Rates
for Bottom 30% Income Households by Commodity Group in CAR
In Percent (2018=100)
| COMMODITY GROUP | November 2022 | October 2023 | November 2023 |
| Food and Non-Alcoholic Beverages | 7.6 | 9.8 | 8.1 |
| FOOD | 7.8 | 10.1 | 8.2 |
| Cereals and cereal products | 3.1 | 10.9 | 12.4 |
| Cereals | 2.1 | 12.2 | 14.2 |
| Rice | 2.0 | 12.3 | 14.4 |
| Corn | 10.3 | 0.5 | 2.1 |
| Flour, bread and other bakery products, pasta products, and other cereals | 8.8 | 4.4 | 3.8 |
| Meat and other parts of slaughtered land animals | 7.6 | -0.2 | 0.0 |
| Fish and other seafood | 5.2 | 5.7 | 5.1 |
| Milk, other dairy products and eggs | 9.4 | 10.5 | 10.7 |
| Oils and fats | 12.1 | -4.7 | -4.5 |
| Fruits and nuts | 4.4 | 9.9 | 8.0 |
| Vegetables, tubers, plantains, cooking bananas and pulses | 18.4 | 31.4 | 12.1 |
| Sugar, confectionery and desserts | 51.9 | 2.6 | -3.5 |
| Ready-made food and other food products n.e.c. | 2.7 | 3.5 | 3.9 |
Note: *Year-on-year change of CPI for November 2022, October 2023 vs November 2023
Source: Retail Price Survey of Commodities for the Generation of Consumer Price Index
Philippine Statistics Authority
On the other hand, higher annual growth rates were registered in the following food groups:
- Rice, 14.4 percent from 12.3 percent;
- Corn, 2.1 percent from 0.5 percent;
- Meat and other parts of slaughtered land animals, 0.0 percent from -0.2 percent;
- Milk, other dairy products and eggs, 10.7 percent from 10.5 percent;
- Oils and fats, -4.5 percent from -4.7 percent; and
- Ready-made food and other food products not elsewhere classified, 3.9 percent from 3.5 percent.
3.2 Main Contributors to the Food Inflation
In terms of contribution to the overall inflation for the bottom 30 percent income group in November 2023, food accounted for 90.3 percent or 3.8 percentage points. Among the food groups, the major contributors to food inflation were as follows:
- Rice, 65.9 percent share or 5.4 percentage points;
- Vegetables, tubers, plantains, cooking bananas and pulses, 14.6 percent share or 1.2 percentage points; and
- Milk, other dairy products and eggs, 6.5 percent share or 0.5 percentage points.
Table D: Year-on-Year Inflation Rates for the
Bottom 30% Income Households in CAR, All Items
In Percent (2018=100)
| Area | November 2022 | October 2023 | November 2023 | Year-to-date* | ||
| Philippines | 9.2 | 5.3 | 7.2 | 6.9 | ||
| CAR | 8.9 | 5.6 | 4.3 | 6.1 | ||
| Abra | 10.8 | 2.2 | 1.5 | 5.7 | ||
| Apayao | 9.2 | 5.6 | 6.4 | 7.1 | ||
| Benguet | 8.1 | 7.0 | 5.7 | 5.9 | ||
| Baguio City | 7.7 | 6.1 | 3.9 | 5.9 | ||
| Ifugao | 3.4 | 14.8 | 12.6 | 7.9 | ||
| Kalinga | 11.3 | 3.6 | 1.3 | 6.2 | ||
| Mountain Province | 9.0 | 2.2 | 2.3 | 5.0 | ||
Note: *Year-on-year change of CPI for November 2022, October 2023 vs November 2023
Source: Retail Price Survey of Commodities for the Generation of Consumer Price Index
Philippine Statistics Authority
- Provinces/ Highly Urbanized City (HUC) in CAR
Among the provinces and Highly Urbanized City (HUC) in the Cordillera Administrative Region (CAR), four exhibited deceleration in their inflation rates. Kalinga experienced the most significant deceleration, with a decrease of 2.3 percentage points from 3.6 percent to 1.3 percent in November 2023. Following closely, Baguio City and Ifugao both saw a 2.2 percentage point decrease, moving from 6.1 percent to 3.9 percent and 14.8 percent to 12.6 percent, respectively, in November 2023. Additionally, the following provinces recorded lower inflation rates during November 2023:
- Benguet: 5.7 percent from 7.0 percent.
- Abra: 1.5 percent from 2.2 percent.
In contrast, two provinces registered higher inflation rates. Apayao increased by 0.8 percentage points, rising from a 5.6 percent inflation rate in October 2023 to 6.4 percent in November 2023. Similarly, Mountain Province increased by 0.8 percentage points, from 2.2 percent to 2.3 percent in November 2023.
Meanwhile, Ifugao held the highest inflation rate at 12.6 percent, down from 14.8 percent in October 2023. This was followed by Apayao with 6.4 percent and Benguet with 5.7 percent.
Note: CPI and inflation rates by province and selected city are posted on the PSA website (http://openstat.psa.gov.ph).
(SGD)
VILLAFE P. ALIBUYOG
Regional Director
AFRB/RJPA/NLP
| Attachment | Size |
|---|---|
|
|
397.68 KB |