

Release Date :
Reference Number :
2025-CARAP-SR02
Inflation rate decelerated to -0.6 percent in January 2025
Table 1. Year-on-Year Inflation Rates in Apayao Province, All Items in Percent January 2025 (2018=100)
January 2024 | December 2024 | January 2025 | Year-to-date |
6.9 | 0.6 | -0.6 | -0.6 |
Source: Retail Price Survey of Commodities for the Generation of Consumer Price Index, Philippine Statistics Authority
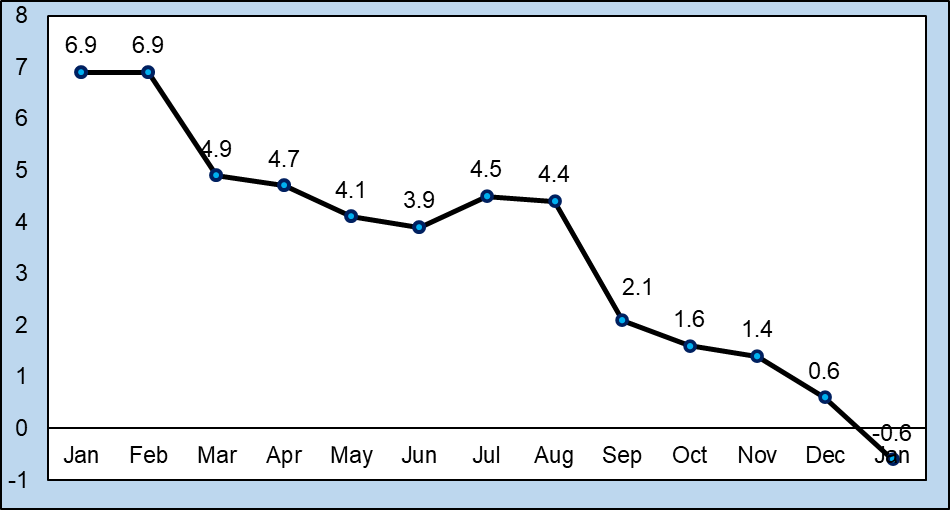
The province’s inflation rate decelerated to -0.6 percent in January 2025 from 0.6 percent in December 2024. It is lower by 7.5 percentage points compared with the same month of the previous year at 6.9 percent and 1.2 percentage point lower than December 2024 at 0.6 percent. (Table 1 and Figure 1)
Figure 1. Year-on Year Inflation Rate, All Items in Percent, January 2024 – January 2025 (2018=100)
Source: Retail Price Survey of Commodities for the Generation of Consumer Price Index, Philippine Statistics Authority
Table 2. Year-on-Year Consumer Price Index in Apayao, By Commodity Groups in Percent (2018=100)
Commodity Groups | January 2024 | December 2024 | January 2025 |
ALL ITEMS | 129.4 | 128.7 | 128.6 |
I. Food and Non-Alcoholic Beverages | 133.1 | 131.3 | 130.3 |
II. Alcoholic Beverages and Tobacco | 160.8 | 165.9 | 164.8 |
III. Clothing and Footwear | 120.8 | 122.0 | 122.3 |
IV. Housing, Water, Electricity, Gas and Other Fuels | 128.7 | 126.5 | 127.4 |
V. Furnishing, Household Equipment and Routine Household Maintenance | 115.1 | 116.8 | 117.2 |
VI. Health | 114.6 | 115.0 | 115.3 |
VII. Transport | 130.7 | 129.5 | 130.8 |
VIII. Information and Communication | 103.4 | 105.7 | 106.0 |
IX. Recreation, Sport and Culture | 135.8 | 137.9 | 139.0 |
X. Education Services | 109.4 | 117.8 | 117.8 |
XI. Restaurants and Accommodation Services | 155.4 | 159.3 | 159.3 |
XII. Financial Services | 146.0 | 146.0 | 146.0 |
XIII. Personal Care, and Miscellaneous Goods and Services | 117.0 | 120.3 | 122.1 |
Source: Retail Price Survey of Commodities for the Generation of Consumer Price Index, Philippine Statistics Authority
The overall CPI decreased from 129.4 of the same month of the previous year to 128.6 in January 2025, representing a -0.6 percent inflation rate. The data shows that the value of goods amounting to 100 pesos in the base year 2018 values 129.40 pesos in January 2024; 128.70 pesos in December 2024; and 128.60 pesos in January 2025. When the CPI decreases, it indicates that the average price level of goods and services has also decreased, and vice versa. (Table 2)
Table 3. Year-on-Year Inflation Rates in Apayao, By Commodity Groups in Percent (2018=100)
Commodity Groups | January 2024 | December 2024 | January 2025 |
ALL ITEMS | 6.9 | 0.6 | -0.6 |
I. Food and Non-Alcoholic Beverages | 14.6 | 1.0 | -2.1 |
II. Alcoholic Beverages and Tobacco | 7.3 | 3.7 | 2.5 |
III. Clothing and Footwear | 1.6 | 0.9 | 1.2 |
IV. Housing, Water, Electricity, Gas and Other Fuels | 1.3 | -1.7 | -1.0 |
V. Furnishing, Household Equipment and Routine Household Maintenance | 0.2 | 1.5 | 1.8 |
VI. Health | 0.8 | 1.0 | 0.6 |
VII. Transport | -7.3 | -1.7 | 0.1 |
VIII. Information and Communication | 0.2 | 2.2 | 2.5 |
IX. Recreation, Sport and Culture | 3.6 | 1.3 | 2.4 |
X. Education Services | 0.0 | 7.7 | 7.7 |
XI. Restaurants and Accommodation Services | 3.3 | 8.7 | 2.5 |
XII. Financial Services | 0.0 | 0.0 | 0.0 |
XIII. Personal Care, and Miscellaneous Goods and Services | -0.1 | 2.7 | 4.4 |
Source: Retail Price Survey of Commodities for the Generation of Consumer Price Index, Philippine Statistics Authority
The commodity groups which have the highest percentage share in the downtrend during the period are:
Food and Non-Alcoholic Beverages, which accounted for -2.1 percent inflation and had a 93.8 percent share in the overall trend;
Restaurants and Accommodation Services, which accounted for 2.5 percent inflation and had a 4.1 percent share in the overall trend;
Alcoholic Beverages and Tobacco, which accounted for 2.5 percent inflation and had a 1.5 percent share in the overall trend; and
Health, which accounted for 0.6 percent inflation and had a 0.6 percent
Moreover, the following commodity sub-class which had the highest percent share in the trend during the month of January 2025 are:
Rice with 92.6 percent;
Restaurants, café and the like - with full service with 4.1 percent;
Other vegetable-based tobacco products with 1.0 percent;
Fruit and vegetables juices, powder with 0.7 percent;
Alcohol for medical uses, fluids required for dialysis, as well as gases used in health care, such as oxygen, when the patient purchases them directly with 0.6 percent;
Spirits and liquors with 0.5 percent;
Corn with 0.3 percent;
Coffee with 0.1 percent; and
Margarine and similar preparations with 0.1 percent.
Meanwhile, the commodity groups which contributed to the inflation are:
Food and Non-Alcoholic Beverages which has an inflation rate of -2.1 percent, particularly on the following items:
Rice with -18.7 percent;
Onions and shallots, fresh or chilled with -26.4 percent;
Mangoes, guavas and mangosteens, fresh with -24.2 percent.
Housing, Water, Electricity, Gas and Other Fuels which has an inflation rate of -1.0 percent, particularly on:
Electricity from all sources (coal, solar, hydro, etc.) with -9.3 percent inflation
However, there are commodity groups which increased on their inflation rate:
Transport which increased by 1.8 percentage points;
Personal Care, and Miscellaneous Goods and Services which increased by 1.7 percentage point;
Recreation, Sport and Culture which increased by 1.1 percentage points;
Housing, Water, Electricity, Gas and Other Fuels which increased by 0.7 percentage points;
Furnishings, Household Equipment and Routine Household Maintenance increased by 0.3 percentage point;
Information and Communication which increased by 0.3 percentage points; and
Clothing and Footwear which increased by 0.3 percentage points
(Table 3 and Figure 2)
On the other hand, the commodity groups with constant inflation compared to the previous month are:
Education Services with 0.0 percent; and
Financial Services with 0.0 percent.
(Table 3 and Figure 2)
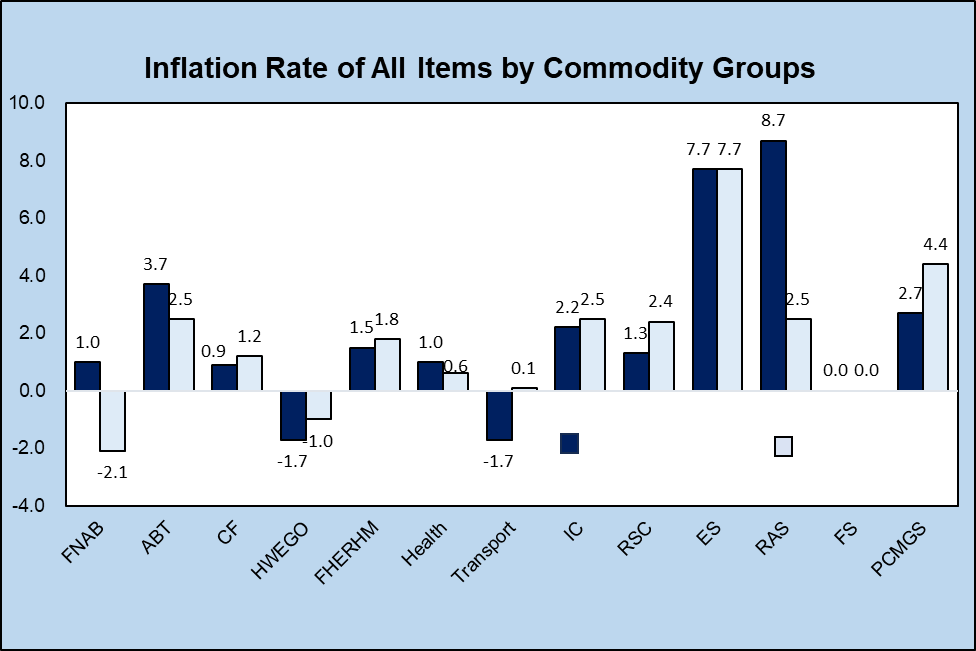
Figure 2. Inflation Rate of All Items by Commodity Groups, Comparison Between December 2024 and January 2025
Source: Retail Price Survey of Commodities for the Generation of Consumer Price Index, Philippine Statistics Authority
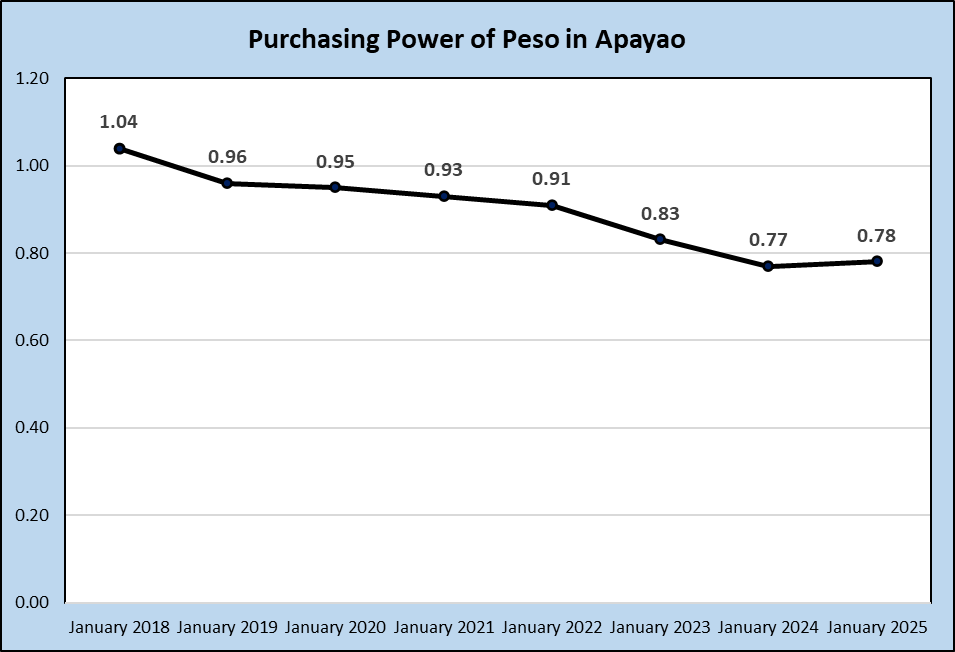
Figure 3. Purchasing Power of Peso in Apayao (2018=100): January 2018 – January 2025
Source: Retail Price Survey of Commodities for the Generation of Consumer Price Index, Philippine Statistics Authority
Purchasing Power of Peso (PPP) recorded at 0.78 in January 2025
Purchasing power of peso continues to weaken through the years but slightly increased to 0.78 in January 2025. The PPP of 0.78 implies that the Php1.00 in the base year 2018 values only Php 0.78 in January 2025. A low purchasing power signifies that the currency has depreciated in value and can acquire a reduced amount of goods and services. Conversely, a high purchasing power of the peso indicates that the currency can purchase a greater quantity of goods and services. (Figure 3)
DEFINITION OF TERMS
Consumer Price Index (CPI) measures the overall change in consumer prices based on a representative basket of goods and services over time.
Inflation refers to an overall increase in the Consumer Price Index (CPI), which is a weighted average of prices for different goods.
Purchasing power of the peso shows how much the peso in the base period is worth in the current period. It is computed as the reciprocal of the CPI for the period under review multiplied by 100.
Commodity Groups are group of goods and services found in the market basket of the province. There are thirteen (13) commodity groups which were arranged according to the PCOICOP.
FNAB stands for Food and Non-Alcoholic Beverages
ABT stands for Alcoholic Beverages and Tobacco
CF stands for Clothing and Footwear
HWEGO stands for Housing, Water, Electricity, Gas, and Other Fuels
FHERHM stands for Furnishings, Household Equipment and Routine Household Maintenance
IC stands for Information and Communication
RSC stands for Recreation, Sport, and Culture
ES stands for Education Services
RAS stands for Restaurants and Accommodation Services
FS stands for Financial Services
PCMGS stands for Personal Care, Miscellaneous Goods and Services
Approved by:
GEOFFREY B. CALIMUHAYAN
Chief Statistical Specialist
LSBT
| Attachment | Size |
|---|---|
|
|
335.06 KB |