

Release Date :
Reference Number :
SPR 2024-11
Table A: Year-on-Year Inflation Rates for All Items in CAR
In Percent
(2018=100)
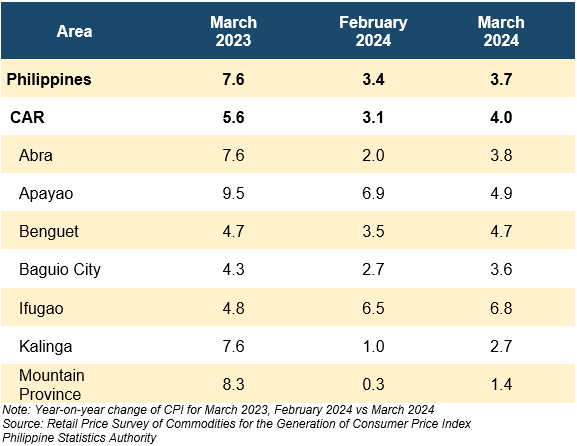
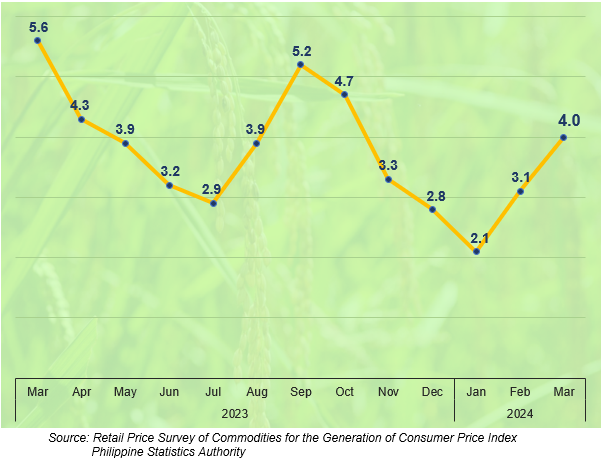
Figure 1: Inflation Rates in Cordillera Administrative Region, All Items:
March 2023 - March 2024 (2018=100)
1. Cordillera Administrative Region (CAR)
The inflation rate in the Cordillera Administrative Region (CAR) accelerated to 4.0% in March 2024 from 3.1% in February 2024. In March 2023, the inflation rate in the region was higher with 5.6% (Table A and Figure 1).
1.1 Main Drivers to the Upward Trend of Inflation in Cordillera
The primary contributor to the upward trend in inflation in March 2024 was the acceleration in the annual increase of the heavily-weighted Food and Non-alcoholic Beverages, with an inflation rate of 6.4% from 4.5% in February 2024. This commodity group accounted for a 68.6% share in the overall inflation uptrend in the region. Another commodity group with a significant contribution was Housing, Water, Electricity, Gas and Other Fuels with 20.7% share in the inflation uptrend and an inflation rate of 0.5%, from -0.3% in February 2024 (Table B and Figure 1).
Table B: Year-on-Year Inflation Rates for Commodity Group in CAR
In Percent (2018=100)
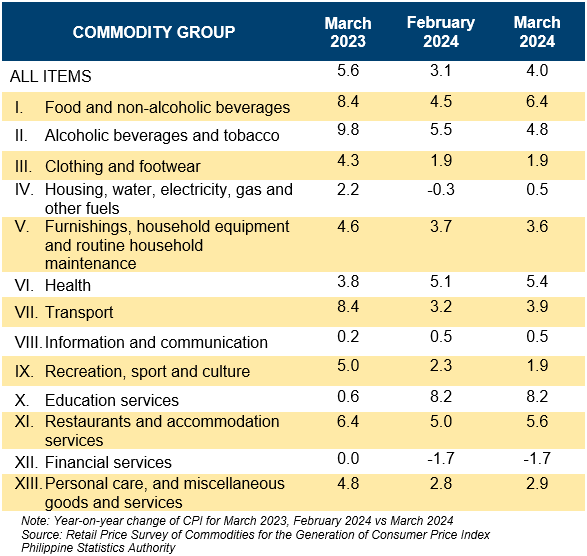
Moreover, higher annual growth rates were noted in the indices of the following commodity groups during the month:
a. Health, 5.4% from 5.1%;
b. Transport, 3.9% from 3.2%;
c. Restaurants and Accommodation Services, 5.6% from 5.0%; and
d. Personal Care, and Miscellaneous Goods and Services, 2.9% from 2.8%.
Conversely, three commodity groups exhibited slower inflation rates:
a. Alcoholic Beverages and Tobacco, 4.8% from 5.5%;
b. Furnishings, Household Equipment and Routine Household Maintenance, 3.6% from 3.7%; and
c. Recreation, Sport and Culture, 1.9% from 2.3%.
The indices of the rest of the commodity groups retained their respective previous month’s annual rates (Table B).
1.2 Main Contributors to Cordillera Inflation
In terms of contribution to the March 2024 inflation, Food and Non-alcoholic Beverages was the highest contributor with a 58.1% share or 2.3 percentage points to the 4.0% inflation in CAR. This was followed by:
a. Transport with 9.4% share or 0.3 percentage points; and
b. Education Services with a 7.6% share or 0.3 percentage points.
2. Food Inflation in CAR
Food inflation in the region rose to 6.6% in March 2024, from 4.5% in February 2024. In March 2023, food inflation was higher at 8.6% (Table C).
Table C: Year-on-Year Inflation Rates for Food in CAR
In Percent (2018=100)
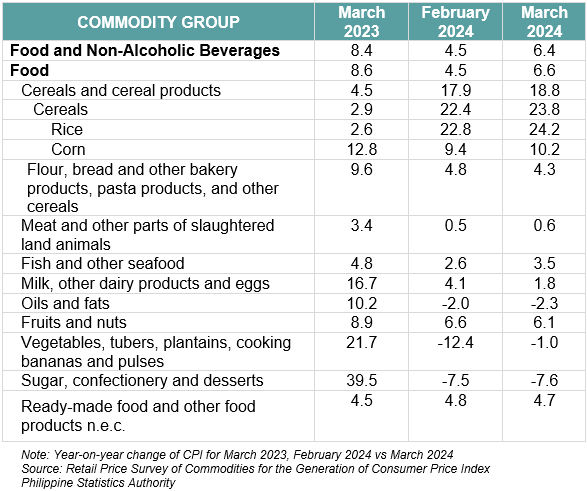
2.1 Main Drivers of the Upward Trend in Food Inflation
The slowdown of food inflation in March 2024 was mainly brought about by the slower year-on-year decrease in the Vegetables, Tubers, Plantains, Cooking Bananas, and Pulses index accounting for a 73.2% share in the uptrend. This food group registered a deflation rate of -1.0%, from -12.4% in February 2024. However, the deflation on these food items were not able to offset the inflation of Cereals and Cereal Products that contributed to the upward trend of food inflation in the Region. It registered 18.8%, from 17.9% in February 2024, accounting for a 19.2% share in the uptrend.
In addition, higher annual growth rates were noted in the following food groups during the month:
a. Meat and Other Parts of Slaughtered Land Animals, 0.6% from 0.5%; and
b. Fish and Other Seafood, 3.5% from 2.6%.
On the contrary, slower annual growth rates were observed in the indices of the following food items:
a. Flour, Bread and Other Bakery Products, Pasta Products, and Other Cereals, 4.3% from 4.8%;
b. Milk, Other Dairy Products and Eggs, 1.8% from 4.1%;
c. Sugar, Confectionery and Desserts, -7.6% from -7.5%;
d. Oils and Fats, -2.3% from -2.0%;
e. Fruits and Nuts, 6.1% from 6.6%; and
f. Ready-made Food and Other Food Products n.e.c., 4.7% from 4.8%.
2.2 Main Contributors to Cordillera Food Inflation
Food inflation shared 56.6 percent or 2.2 percentage points to the overall inflation in March 2024. The top three food groups in terms of contribution to the food inflation during the month were the following:
a. Cereals and Cereal Products, which includes rice, corn, flour, bread and other bakery products, pasta products, and other cereals, with 90.1% share or 5.9 percentage points;
b. Fish and Other Seafood, with 5.7% share or 0.3 percentage points; and
c. Fruits and Nuts with a 4.2% share or 0.2 percentage points.
3. Provinces/ Highly Urbanized City (HUC) in CAR
In March 2024, all provinces and the highly urbanized city of Baguio experienced an uptrend in inflation rates, except for the province of Apayao, which registered an inflation of 4.9% from 6.9% the previous month, representing a slowdown of 1 percentage point. Ifugao recorded the highest inflation rate in the region with 6.8%. Conversely, Mountain Province maintained its position with the slowest inflation rate, registering 1.4%.
Provinces/Highly Urbanized City with faster inflation rates compared to previous month:
a. Abra: 3.8%, from 2.0%;
b. Baguio City: 3.6%, from 2.7%;
c. Benguet: 4.7%, from 3.5%;
d. Ifugao: 6.8%, from 6.5%;
e. Kalinga: 2.7%, from 1.0%; and
f. Mountain Province: 1.4% from 0.3%.
________________________________________________________________
Note:
CPI and inflation rates by province and selected city are posted on the PSA website (http://openstat.psa.gov.ph).
(SGD)
VILLAFE P. ALIBUYOG
Regional Director
AFRB/NLP
Technical Notes
Concepts and Definitions of Terms
Base Period a reference period, usually a year, at which the index number is set to 100. It is the reference point of the index number series.
Consumer Price Index (CPI) is an indicator of the change in the average retail prices of a fixed basket of goods and services commonly purchased by an average Filipino household. It shows how much on average, prices of goods and services have increased or decreased from a particular reference period known as base year.
Inflation Rate refers to the annual rate of change or the year-on-year change of the CPI expressed in percent. Inflation is interpreted in terms of the declining purchasing power of money.
Market Basket for CPI purposes, market basket is a term used to refer to a sample of goods and services that are commonly purchased and bought by an average Filipino household.
Philippine Classification of Individual Consumption According to Purpose (PCOICOP) A detailed classification of individual consumption expenditures on goods and services incurred by the three (household, general government, non-profit institutions serving households) of the five institutional sectors (non-financial corporations, financial corporations) of the 1993 and 2008 Systems of National Accounts (SNA). The PCOICOP was patterned after the United Nations COICOP.
Purchasing Power of the Peso (PPP) shows how much the peso in the base period is worth in the current period. It is computed as the reciprocal of the CPI for the period under review multiplied by 100.
Weight is a value attached to a commodity or group of commodities to indicate the relative importance of that commodity or group of commodities in the market basket.
| Attachment | Size |
|---|---|
|
|
364.23 KB |