

Release Date :
Reference Number :
SPR 2024-34
Table A: Year-on-Year Inflation Rates for All Items in CAR
September 2023, August-September 2024
In Percent (2018=100)
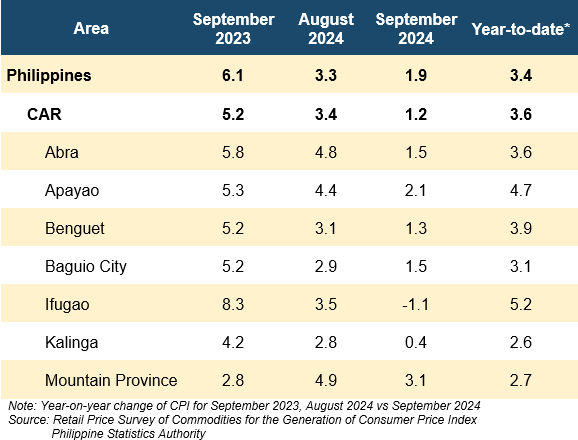
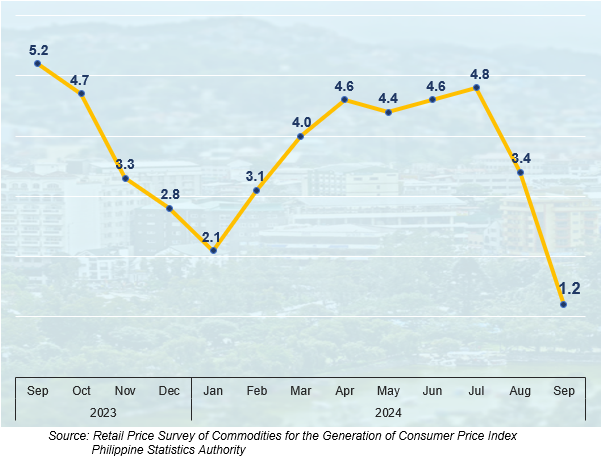
Figure 1: Inflation Rates in Cordillera Administrative Region, All Items:
September 2023 - September 2024
In Percent (2018=100)
1. Cordillera Administrative Region (CAR)
The region’s inflation rate for all income households further decelerated to 1.2% in September 2024 from 3.4% in August 2024. This marks the lowest rate since October 2020, which also recorded an inflation rate of 1.2%. The average regional inflation from January to September 2024 was 3.6%. In September 2023, the inflation rate in the region was at 5.2% (Table A and Figure 1).
1.1 Main Drivers to the Downtrend of Inflation in Cordillera
In September 2024, the decline in inflation was primarily driven by lower prices in the Food and Non-Alcoholic Beverages, which experienced a negative inflation rate of -0.3%, from 4.0% in August 2024. This commodity group accounted for 73.1% of the overall inflation deceleration in the region.
Another significant contributor was Education Services, which had a 13.0% share in the inflation downtrend and an inflation rate of 0.3%, from 7.8% in the previous month. The Transport sector contributed 9.1% to the downtrend, with an inflation rate of 0.3%, from 2.3% in August 2024 (see Table B and Figure 1).
Table B: Year-on-Year Inflation Rates by Commodity Group, CAR:
September 2023, August-September 2024
In Percent (2018=100)
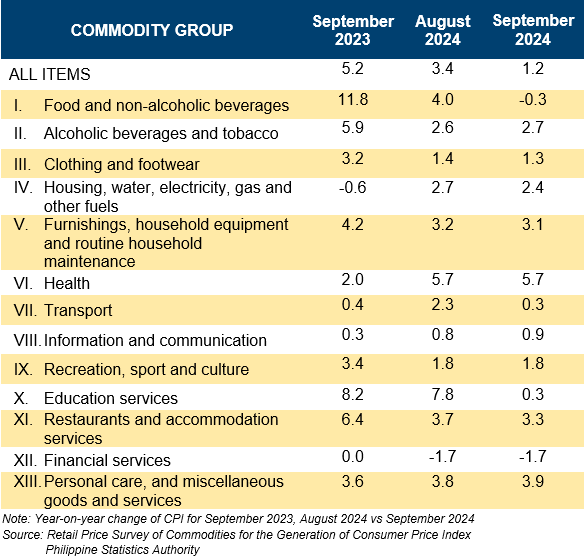
Lower annual inflation rates were observed in the following commodity groups during the month:
a. Housing, Water, Electricity, Gas and Other Fuels, 2.4% from 2.7%;
b. Restaurants and Accommodation Services, 3.3% from 3.7%;
c. Clothing and Footwear, 1.3% from 1.4%; and
d. Furnishings, Household Equipment and Routine Household Maintenance, 3.1% from 3.2%.
Conversely, three commodity groups registered higher inflation rates:
a. Alcoholic Beverages and Tobacco, 2.7% from 2.6%.
b. Information and Communication, 0.9% from 0.8%; and
c. Personal care, and miscellaneous goods and services, 3.9% from 3.8%.
The remaining commodity groups maintained their previous month’s annual rates:
a. Health, 5.7%;
b. Recreation, Sport and Culture, 1.8%; and
c. Financial Services, -1.7%.
1.2 Main Contributors to Cordillera Inflation
In September 2024, the Housing, Water, Electricity, Gas and Other Fuels category emerged as the primary contributor to inflation in the region, as Food and Non-Alcoholic Beverages registered a negative inflation rate of -0.3%. This category accounted for 47.4% of the overall inflation, contributing 0.5 percentage points to the total inflation rate of 1.2%.
This was followed by:
a. Health, 16.5% share or 0.2 percentage points; and
b. Personal Care, and Miscellaneous Goods and Services, 12.9% share or 0.1 percentage points.
2. Food Inflation in CAR
The food inflation in the region decline to -0.5% in September 2024 from 4.1% in August 2024. In September 2023, food inflation was significantly higher at 12.3%
(Table C).
2.1 Main Drivers of the Downtrend in Food Inflation
The deceleration in food inflation in September 2024 was primarily influenced by slower year-on-year growth of Rice, that accounted 55.5% share in the decline. This food group recorded an inflation rate of 10.0% in September 2024, from 19.0% in August 2024. This followed by Vegetables, Tubers, Plantains, Cooking Bananas, and Pulses with 38.1% share in the decline with -26.6% from -11.8%.
The decrease in food inflation in September 2024 was primarily driven by a slower year-on-year growth in Rice, which accounted for a 55.5% share of the slowdown. Rice recorded an inflation rate of 10.0% in September 2024, down from 19.0% in August 2024. This was followed by Vegetables, Tubers, Plantains, Cooking Bananas, and Pulses, contributing to 38.1% of the decline with an inflation rate of -26.6%, from -11.8% the previous month.
Additionally, lower annual rates were observed in the following food groups during the month:
a. Meat and Other Parts of Slaughtered Land Animals, 3.1% from 4.2%;
b. Fruits and Nuts, 2.7% from 3.8%;
c. Ready-Made Food and Other Food Products n.e.c., 5.8% from 6.0%; and
d. Corn, 6.5% from 7.9%.
Table C: Year-on-Year Inflation Rates by Food Group, CAR:
September 2023, August-September 2024
In Percent (2018=100)

Conversely, higher inflation rates were noted for the following food items in September 2024:
a. Fish and Other Seafood, 0.4% from 0.2%;
b. Milk, Other Dairy Products and Eggs, 3.5% from 3.4%;
c. Flour, Bread and Other Bakery Products, Pasta Products, and Other Cereals, 3.7% from 3.4%; and
d. Sugar, Confectionery and Desserts, -4.1% from -5.2%.
The Oils and Fats group maintained an inflation rate of -0.6%.
2.2 Main Contributors to Cordillera Food Inflation
Food inflation contributed 35.1% or -0.2 percentage points to the overall inflation rate of 1.2% in the region in September 2024. The top three food groups contributing to the -0.5% food inflation during the month were:
a. Vegetables, Tubers, Plantains, Cooking Bananas, and Pulses, -241.8% share or 1.2 percentage points;
b. Sugar, Confectionery and Desserts, -11.6% share or 0.06 percentage points; and
c. Oils and Fats, 1.0% share or 0.005 percentage points.
The negative contribution from Vegetables and Tubers was offset by Rice, which had a 10% inflation rate and a 227.5% share, contributing 1.1 percentage points. Additionally, other food groups with positive inflation also balanced some of the negative inflation from Vegetables and Tubers and other food commodities that registered negative inflation.
3. Provinces/ Highly Urbanized City (HUC) in CAR
In September 2024, inflation rates decelerated across the five provinces and the City of Baguio in the Cordillera region. The inflation rates are as follows:
a. Abra: 1.5% from 4.8%;
b. Apayao: 2.1% from 4.4%;
c. Baguio City: 1.5% from 2.9%;
d. Benguet: 1.3% from 3.1%;
e. Ifugao: -1.1% from 3.5%;
f. Kalinga: 0.4% from 2.8%; and
g. Mountain Province: 3.1% from 4.9%.
Among these areas, Mountain Province experienced the highest inflation rate in the region at 3.1%. Conversely, Ifugao reported the lowest inflation rate in CAR at -1.1% (Table A).
________________________________________________________________
Note:
CPI and inflation rates by province and selected city are posted on the PSA website (http://openstat.psa.gov.ph).
(SGD)
VILLAFE P. ALIBUYOG
Regional Director
| Attachment | Size |
|---|---|
|
|
326.72 KB |