

Release Date :
Reference Number :
SPR 2024-28
Table A: Year-on-Year Inflation Rates for All Items in CAR
In Percent (2018=100)
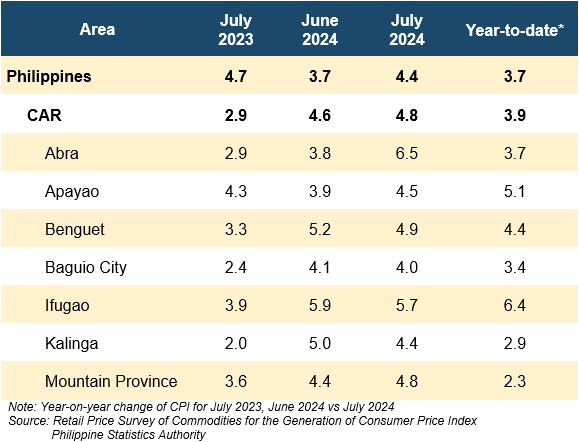
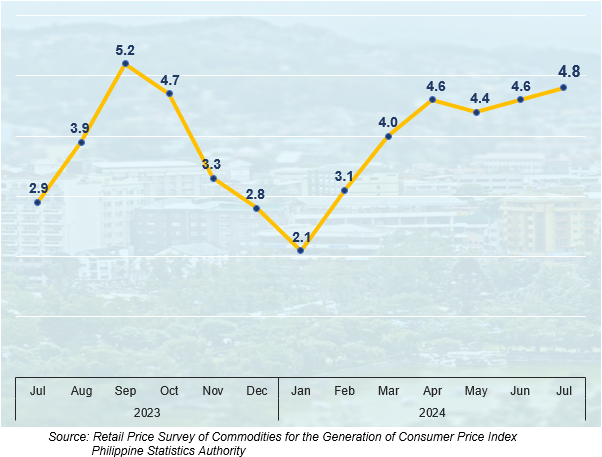
Figure 1: Inflation Rates in Cordillera Administrative Region, All Items:
July 2023 - July 2024 (2018=100)
1. Cordillera Administrative Region (CAR)
The region’s inflation rate for all income households rose to 4.8% in July 2024 from 4.6% in June 2024. This brings the regional average inflation from January to July 2024 to 3.9%. In July 2023, the inflation rate in the region was posted at 2.9% (Table A and Figure 1).
1.1 Main Drivers to the Uptrend of Inflation in Cordillera
In July 2024, the uptrend was primarily driven by higher year-on-year growth in the Housing, Water, Electricity, Gas, and Other Fuels, with an inflation rate of 2.8% from 2.3% in June 2024. This commodity group contributed 60.3% share to the overall inflation increase in the region. Another notable contributor was Transport with 22.4% share in the inflation uptrend and an inflation rate of 6.5% from 6.0% in the previous month. Restaurants and Accommodation Services contributed 7.5% share to the uptrend, with an inflation rate of 4.6% from 4.2% in June 2024 (Table B and Figure 1).
Table B: Year-on-Year Inflation Rates by Commodity Group, CAR:
July 2023 - July 2024
In Percent (2018=100)
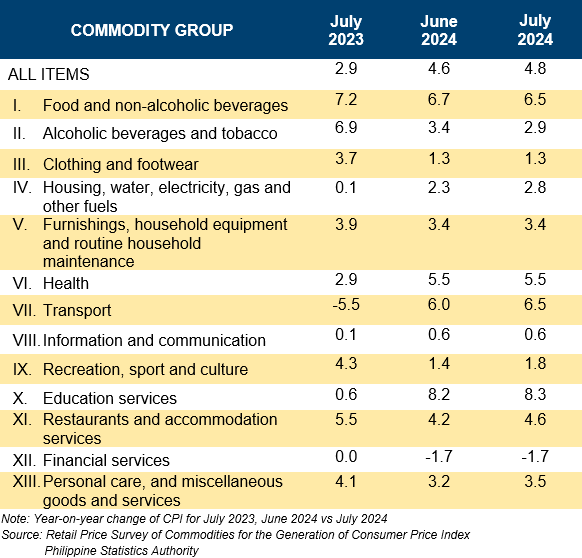
Higher annual inflation rates were noted in the indices of the following commodity groups during the month:
a. Personal Care, and Miscellaneous Goods and Services, 3.5% from 3.2%;
b. Recreation, Sport and Culture, 1.8% from 1.4%; and
c. Education Services, 8.3% from 8.2%.
Conversely, two commodity groups showed slower inflation rates:
a. Food and Non-Alcoholic Beverages, 6.5% from 6.7%; and
b. Alcoholic Beverages and Tobacco, 2.9% from 3.4%.
The remaining commodity groups maintained their previous month’s annual rates:
a. Health, 5.5%;
b. Information and Communication, 0.6%;
c. Clothing and Footwear, 1.3%;
d. Furnishings, Household Equipment and Routine Household Maintenance, 3.4%; and
e. Financial Services, -1.7%.
1.2 Main Contributors to Cordillera Inflation
In July 2024, Food and Non-Alcoholic Beverages commodity group continued to be the primary contributor to inflation in CAR, accounting 49.0% share, contributing 2.3 percentage points to the overall 4.8% inflation. This was followed by:
a. Housing, Water, Electricity, Gas, and Other Fuels, 15.1% share or 0.7 percentage points; and
b. Transport,13.1% share or 0.6 percentage points.
2. Food Inflation in CAR
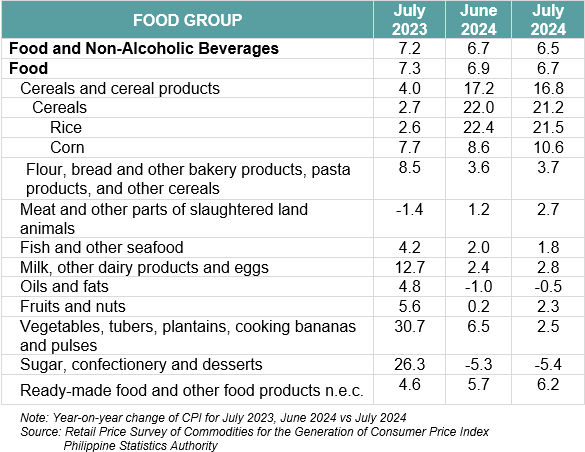
The region registered a slight deceleration in food inflation with 6.7% in July 2024 from 6.9% in June 2024. In July 2023, food inflation was 7.3% (Table C).
Table C: Year-on-Year Inflation Rates by Food Group, CAR:
July 2023, June-July 2024
In Percent (2018=100)
2.1 Main Drivers of the Downtrend in Food Inflation
The deceleration in food inflation in July 2024 was primarily influenced by slower year-on-year growth in Vegetables, Tubers, Plantains, Cooking Bananas, and Pulses that accounted 71.6% share in the decline. This food group recorded an inflation rate of 2.5% in July 2024, from 6.5% in June 2024.
Additionally, slower annual rates were observed in the following food groups during the month:
a. Rice, 21.5% from 22.4%;
b. Fish and Other Seafood, 1.8% from 2.0%; and
c. Sugar, Confectionery and Desserts, -5.4% from -5.3%.
On the other hand, higher annual inflation rates were noted in the indices of the following food items in July 2024:
a. Corn, 10.6% from 8.6%;
b. Flour, Bread and Other Bakery Products, Pasta Products, and Other Cereals, 3.7% from 3.6%;
c. Meat and Other Parts of Slaughtered Land Animals, 2.7% from 1.2%;
d. Milk, Other Dairy Products and Eggs, 2.8% from 2.4%;
e. Oils and Fats, -0.5% from -1.0%;
f. Fruits and Nuts, 2.3% from 0.2%; and
g. Ready-Made Food and Other Food Products n.e.c., 6.2% from 5.7%.
2.2 Main Contributors to Cordillera Food Inflation
Food inflation contributed 47.3% or 2.2 percentage points to the 4.8% overall inflation of the region in July 2024. The top three food groups in terms of contribution to the 6.7% Food inflation during the month were the following:
a. Rice, 77.6% share or 5.2 percentage points;
b. Meat and Other Parts of Slaughtered Land Animals, 6.5% share or 0.4 percentage points;
c. Vegetables, Tubers, Plantains, Cooking Bananas, and Pulses, 3.7% share or 0.2 percentage points.
3. Provinces/ Highly Urbanized City (HUC) in CAR
In July 2024, inflation rates rose in the three provinces in the Cordillera. Abra saw a significant increase from 3.8% to 6.5%, Mountain Province's rate climbed from 4.4% to 4.8%, and Apayao's rate went up from 3.9% to 4.5%. Among the six provinces and the City of Baguio, Abra recorded the highest inflation rate in the region with 6.5%. In contrast, Baguio City reported the lowest inflation rate in CAR, with a rate of 4.0%.
Provinces and Highly Urbanized City with lower inflation rates:
a. Baguio City: 4.0% from 4.1%;
b. Benguet, 4.9% from 5.2%;
c. Ifugao, 5.7% from 5.9%; and
d. Kalinga, 4.4% from 5.0%.
___________________________________________________________
Note:
CPI and inflation rates by province and selected city are posted on the PSA website (http://openstat.psa.gov.ph).
(SGD)
VILLAFE P. ALIBUYOG
Regional Director
AFRB/RJPA/NLP
| Attachment | Size |
|---|---|
|
|
323.6 KB |