Release Date :
Reference Number :
SR 2020-40
Extreme Events and Disasters is one of the six components of the United Nations Framework for the Development of Environment Statistics (FDES) 2013. This framework was adopted in the Cordillera Administrative Region (CAR) to come up with CAR Regional Compendium of Environment Statistics. Component 4 has two subcomponents namely, Natural Extreme Events and Disasters and Technological Disasters.

DISASTERS
The Centre for Research on the Epidemiology of Disasters (CRED) defines a disaster as an unforeseen and often sudden event that causes great damage, destruction and human suffering (UN FDES, 2013).
In the country, the National Disaster Risk Reduction Management Council (NDRRMC) identifies events as disasters when they become “serious disruptions of the functioning of a community or a society involving widespread human, material, economic or environmental losses and impacts, which exceeds the ability of the affected community or society to cope using its own resources.”
Natural Extreme Events and Disasters

Natural extreme events and disasters takes into account the frequency and intensity of extreme events and disasters that resulted from natural phenomena (e.g. typhoons and earthquakes) and their impact on human lives and habitats and the environment as a whole.
The four core statistics under this subcomponent are (1) type of natural disaster, (2) location of the event, (3) number of people killed during the event, and (4) economic loss incurred during the event.
However, data on the exact location of the natural extreme events and disasters are not available in national and subnational level and data for the economic loss pertain to the estimated cost of damages.
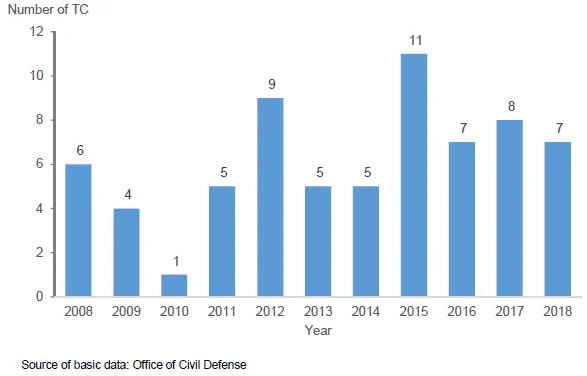
Cordillera was visited by 11 tropical cyclones in 2015
- The Office of the Civil Defense – CAR (OCD-CAR) provided data on the number of tropical cyclones with direct impact to the region. Records showed that the highest number of tropical cyclones was in 2015 with a total of 11 cyclone. On the other hand, 2010 recorded the least with only one tropical cyclone. On the average, the region was visited by six tropical cyclones during the period 2008 to 2018.
Figure 1. Number of Tropical Cyclones, CAR: 2008-2018

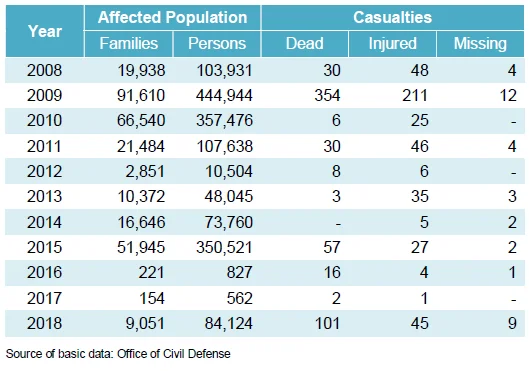
Casualties recorded the highest in 2009 with a total of 577 persons
- Although 2015 recorded the highest number of tropical cyclone visit, it was in 2009 where the affected population and casualties reported the highest. There were a total of 444,944 persons and 91,610 families affected due to the 4 tropical cyclones recorded. The least number of affected population was in 2017 with 154 affected families and 562 affected persons.
- The recorded casualties were also highest in 2009 with a total of 577 persons involved. There were 354 persons reported dead, 211 persons injured and 12 persons missing. The least casualties in 2017 involved three persons with two persons dead and one injured.
Table 1. Affected Population and Casualties Due to Tropical Cyclones,
CAR: 2008-2018

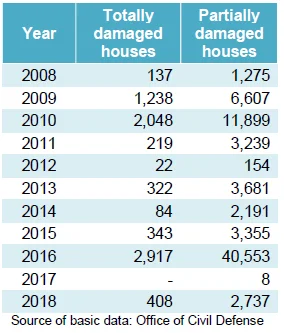
43,470 houses were damaged due to tropical cyclones in 2016
- Economic loss data from OCD-CAR reported number of damage houses and the cost of damage to agriculture and infrastructure due to tropical cyclones.
- The data showed that 2016 posted the biggest economic loss with a total of 43,470 damaged houses of which 93.3 percent or 40,553 were partially damaged and the remaining 6.7 percent or 2,917 were totally damaged.
- On the other hand, 2017 registered the lowest with eight partially damaged houses.
Table 2. Damage Houses Due to Tropical Cyclones,
CAR: 2008-2018

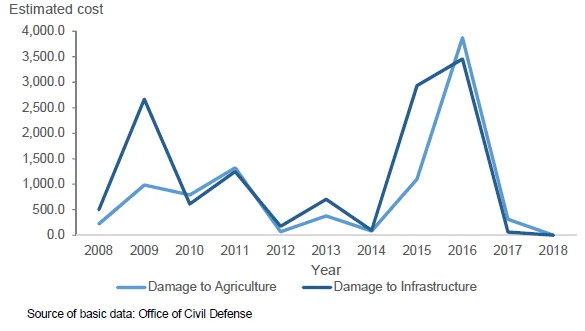
Cost of damage due to tropical cyclone amounted to PHP21.6 billion from 2008 to 2018
- The highest estimated cost of damage was also recorded in 2016 with PHP 7.3 billion of which 52.8 percent or 3.9 billion pesos were the damages to agriculture and 47.2 percent or 3.4 billion were the damages to infrastructure.
- From 2008 to 2018, the region recorded a total of PHP21.6 billion for the damages. Damages to agriculture costed PHP9.1 billion or 42.3 percent of the total estimated cost while damages to infrastructure costed PHP12. 5 billion or 57.7 percent of the total. Aside from 2018 with no record, 2014 posted the least cost of damages with PHP176.4 million.
Figure 2. Estimated Cost of Damage Due to Tropical Cyclones,
CAR: 2008-2018 (In million pesos)

Technological Disasters

- Technological disasters, on the other hand, consider disasters that resulted from human intent, negligence or error, or from faulty or failed technological applications.
- CRED recognizes three types of technological disasters namely, (1) industrial disasters that cover leakages of fluid toxic chemicals, oil spills and explosions; (2) transport disasters that cover accidents associated with the mechanized transport of chemicals, volatile materials or other hazardous substance by road, rail, water or pipeline; and (3) miscellaneous disasters such as arson fires and other disasters of varied origin.
Due to data limitation, no data is collected for this subcomponent.

