Residuals is one of the six components of the United Nations Framework for the Development of Environment Statistics (FDES) 2013. This framework was adopted in the Cordillera Administrative Region (CAR) to come up with CAR Regional Compendium of Environment Statistics. Component 3 has three subcomponents namely, Emissions to Air, Generation and Management of Wastewater and Generation and Management of Waste.

EMISSIONS TO AIR
- Air pollution can be caused by natural as well as anthropogenic factors. The FDES focuses on the emission of pollutants from anthropogenic factors that are socioeconomic processes.
- Emissions to air are gaseous and particulate substance released to the atmosphere by establishments and households as results of production, consumption and accumulation processes (UN FDES, 2013). Indicators on fuel and other material input data and emission factors can be used as indicators to measure or estimate air emissions.
- Statistics on greenhouse gas emission are useful for research, program and policy formulation. Greenhouse gas tends to increase the capacity of the atmosphere to hold heat, one of the drivers of global climate change. (UN FDES, 2013). Greenhouse gas emission inventories are compiled based on the guidelines developed by the Intergovernmental Panel on Climate Change, under the auspices of the United Nations Framework Convention on Climate Change (UNFCC).
- The Philippines ranks third globally when it comes to climate change vulnerability, and is more exposed due to its geographical location and environmental situation. In addition, the Philippines is seen to be more susceptible to extreme events and natural calamities due to climate change (Second National Communication to the United Nations Framework Convention on Climate Change, 1999).
Nitrogen oxide emission in CAR fails to meet the national ambient air guideline
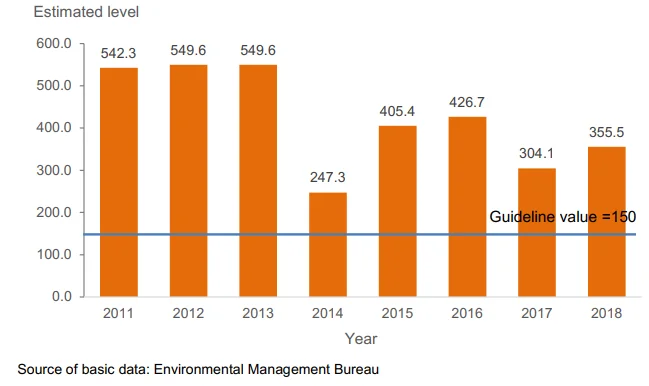
- The national ambient air quality guideline for nitrogen oxide is set at 150 micrograms per normal cubic meters. Based on the result of the estimated nitrogen oxide emission from all sources in CAR, none of the years covered (2011 to 2018) fell below the indicated threshold.
- The highest estimated level was recorded in 2012 and 2013 both with 549.6 micrograms per normal cubic meter. The lowest was estimated in 2014 with 247.3 micrograms per normal cubic meter which was also higher by 64.9 percent than the national guideline.
Figure 1. Estimated Nitrogen Oxide Emission from All Sources:
2011 to 2018 (In micrograms per normal cubic meter)

Sulfur oxide emission in 2018 is at 7.2 micrograms per normal cubic meter
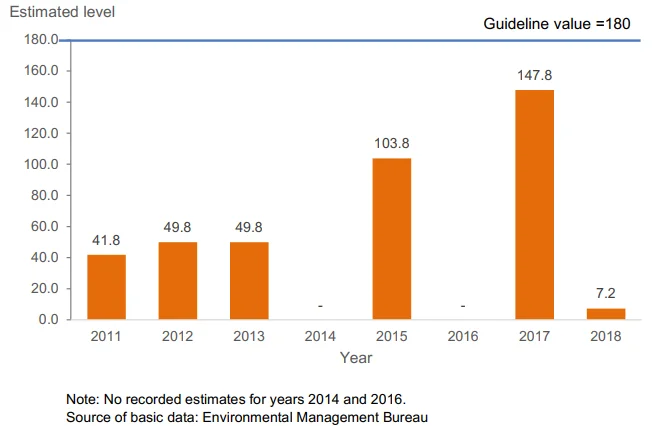
- From 2011 to 2018, the estimated levels of sulfur oxide were below the guideline set at 180 micrograms per normal cubic meters. The highest recorded level was seen in 2017 with 147.8 micrograms per normal cubic meters while the lowest was in 2018 with 7.2 micrograms per normal cubic meters. There was no estimated level of sulfur oxides in the years 2014 and 2016.
Figure 2. Estimated Sulfur Oxide Emission from All Sources:
2011 to 2018 (In micrograms per normal cubic meter)

GENERATION & MANAGEMENT OF WASTEWATER
- This subcomponent deals with generation and management of wastewater. The framework defined wastewater as discarded water no longer required by the owner or user. They are either discharged into sewers, received by treatment facilities, discarded to the environment or reused without prior treatment.
- The data presented only covers those with access to the Baguio Sewerage Facility. It includes volume of wastewater collected, and wastewater treated. The framework also suggests to collect statistics on the number of wastewater disposal facilities but it is not yet included in this report.
Wastewater in Baguio City amounted to 24.1 million m3 from 2008 to 2018
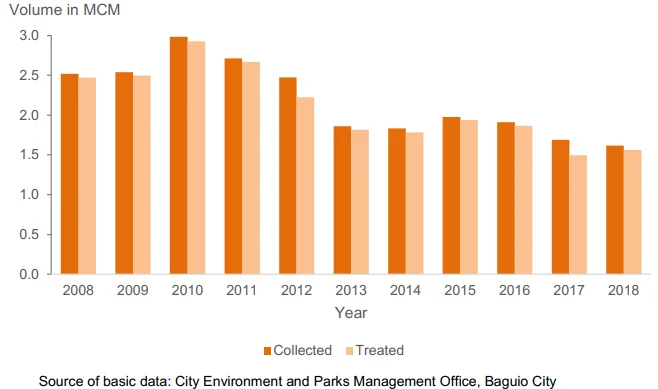
- In the span of 11 years, the volume of wastewater collected in the City of Baguio amounted to 24.1 million cubic meters. The highest volume was recorded in 2010 with 3.0 million cubic meters. On the average, 96.2 percent of the total volume collected were treated and discharged back to the environment.
Figure 3. Volume of Wastewater Collected and Treated, Domestic
Water, Baguio City: 2008-2018 (In million cubic meters)

GENERATION & MANAGEMENT OF WASTE
- The framework defined waste as discarded material for which the owner or user has no further use. Humans generate waste in their daily activities such as in the course of production and consumption processes. It includes materials in solid or liquid state but excludes wastewater and emissions to air, water or soil.
- It is imperative to compile statistics in the generation of waste because disposed solid waste on land and water have negative effects on human and the ecosystems. Human activities directly affect the environment and often lead to environmental changes in the form of depletion and degradation. To reduce the volume of generated waste, it is important to increase the amount of recycled waste and reuse them as material or source of energy. This is essential to ensure sustainable consumption, production and natural resource management.
- The Environmental Management Bureau is mandated in the implementation of Republic Act No. 9003 or the Ecological Solid Waste Management Act of 2000 particularly, its Solid Waste Management Division (SWMD). This subcomponent reports only on the amount of hazardous waste generated and amount of hazardous waste generated. Other statistics under generation and management of waste are not available for compilation.
CAR generates 124.9 thousand tons of hazardous waste in 2018
- Table 1 shows the amount of generated hazardous waste by type of hazardous waste. Based on the available data, the amount on generated hazardous waste increased from 45,804 tons in 2015 to 124,993 tons in 2018 an average increment of 26,396.4 tons of waste yearly. Wastes with cyanide topped the hazardous wastes with 123,398 tons. Alkali wastes came second with 1,369 tons.
Table 1. Amount of Generated Hazardous Waste by Type of Hazardous Waste,
CAR: 2015 to 2018 (In tons)
| Type of Hazardous Waste | 2015 | 2016 | 2017 | 2018 |
|---|---|---|---|---|
| Waste with Cyanide | 44,792.4 | 5,234.7 | 47,804.6 | 123,398.0 |
| Acid Wastes | 0.0 | 77.0 | 0.3 | 1.5 |
| Alkali Wastes | 908.3 | 671.5 | 244.7 | 1,369.2 |
| Inorganic Chemical Wastes | 4.1 | 9.5 | 18.7 | 73.2 |
| Reactive Chemical Waste | 0.0 | 0.2 | 2.7 | 19.1 |
| Organic Solvent | 18.1 | 7.0 | 7.4 | 10.8 |
| Putrescible/Organic Wastes | 8.0 | 8.0 | 11.9 | 6.6 |
| Oil | 5.3 | 21.8 | 45.6 | 95.2 |
| Containers | 1.6 | 3.4 | 5.6 | 1.5 |
| Immobilized Wastes | - | - | - | 2.9 |
| Organic Chemicals | 62.4 | 72.9 | 68.0 | 2.4 |
| Miscellaneous Wastes | 3.9 | 3.0 | 10.1 | 12.9 |
| Total | 45,804.1 | 6,109.2 | 48,219.6 | 124,993.3 |

