Release Date :
Reference Number :
SR 2020-26
Environmental Resources and Their Use is one of the six components of the United Nations Framework for the Development of Environment Statistics (FDES) 2013. This framework was adopted in the Cordillera Administrative Region (CAR) to come up with CAR Regional Compendium of Environment Statistics. Component 2 has four subcomponents, one of which is Biological Resources.

- Biological resources are renewable, therefore, harvest of these resources must not exceed the rate of regeneration.
- At present, there are no core statistics to be compiled under other non-cultivated biological resources. The data presented in this subcomponent came from Department of Environment and Natural Resources (DENR) and the Philippine Statistics Authority (PSA).

Timber resources estimated at 153.2 million cubic meters in 2018
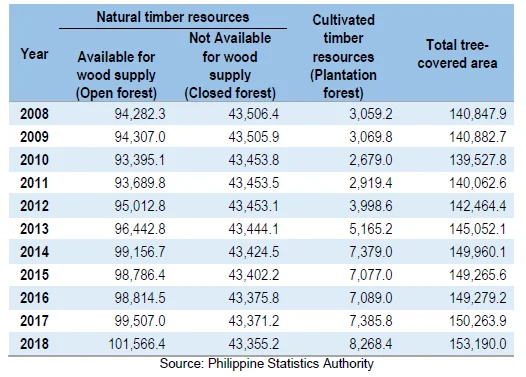
- By the end of 2018, the region had an estimated timber resources of 153.2 million cubic meters, 66.3 percent or 101.6 million cubic meters of which came from open forest, 28.3 percent or 43.4 million cubic meters came from closed forest and 5.4 percent or 8.3 million cubic meters from plantation forest. This was an increase from 140.8 million cubic meters in 2008 representing an 8.8 percent growth rate, with an annual average growth of 0.9 percent or a yearly increment of 1.2 million cubic meters.
- Volume of stock of timber resources in closed forest declined from 43.5 million cubic meters in 2008 to 43.4 million cubic meters in 2018 or an average decrease of 15.1 hectares annually. The closing volume for open forest gradually increased during the period from 94.3 million cubic meters in 1999 to 101.6 million cubic meters in 2018 by an annual average growth of 0.8 percent or an average addition of 728.4 thousand cubic meters. The volume of standing timber in plantation forest also posted an increase. It grew by an annual average of 11.8 percent or 520.9 thousand cubic meters yearly increase from 3.1 million cubic meters in 2008 to 8.3 million cubic meters in 2018.
Table 1. Stock of Timber Resources, CAR: 1999-2018 (In Thousand Cubic Meters)

- Statistics on fish capture production are divided into three: commercial fisheries, inland municipal fisheries, and marine municipal fisheries. Commercial and municipal fishing differs in the capacity of fishing vessels or boats used. Commercial fishing is the catching of fish using boats with capacity of three gross tons, either for trade, business or profit beyond subsistence, or sports. Municipal fishing utilizes fishing vessels with three gross tons or less of capacity.
- Aquaculture production, on the other hand is presented according to the type of environment (brackish water, freshwater or marine water); and type of facility (ponds, pens, cages or reservoirs). Oyster, mussel and seaweed farming are also included under Aquaculture.
Aquaculture is 75% of total fish production
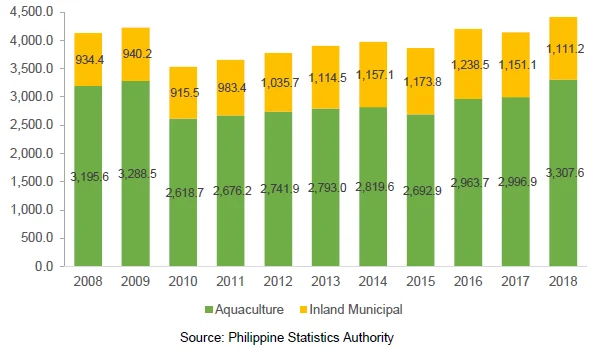
- Fishery production in CAR only includes freshwater aquaculture and inland municipal fishery. About 75 percent of the fish production in the region came from Aquaculture and the remainder was the output of Inland Municipal Fishing. The driver of aquaculture and inland municipal fishery is tilapia production.
Figure 1. Fish Production by Type of Fishery, CAR: 2008 to 2018

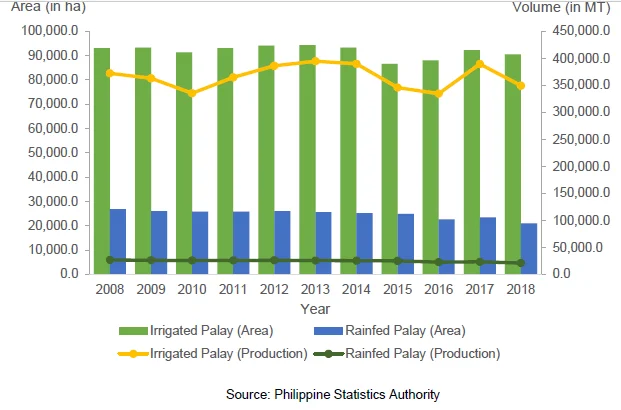
Palay production decreased by 0.9% annual average
- Total area planted/harvested of palay in CAR decreased by an annual average of 0.7 percent from 119,816 hectares in 2008 to 111,387 hectares in 2018 or equivalent to an annual average decline of 842.9 hectares. Area planted/harvested of palay for irrigated palay covered almost 80 percent of the total area while rainfed palay covered the remaining 20 percent.
- Volume of production for palay consequently decreased by an annual average of 0.9 percent or 5,405.1 MT annual decrease from 445,156 MT in 2008 to 391,105 MT in 2018. On the average, irrigated palay contributed 85.8 percent of the total production while rainfed palay shared 14.2 percent.
Figure 2. Area Planted/Harvested and Volume of Production
of Palay in CAR: 2008 to 2018
Corn production increased by an annual average of 1.5%
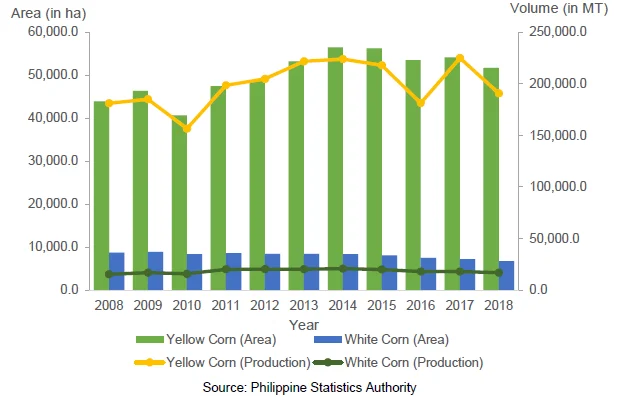
- The total area planted/harvested of corn posted an increase from 52,698 hectares in 2008 to 58,405 hectares in 2018. This translates to an annual average increase of 1.3 percent or 570.7 hectares annual average increase in the total area planted/harvested in the region.
- Volume of production also increased from 196,421 MT in 2008 to 207,439 MT in 2018 with an annual average growth of 1.5 percent or an annual increase of 1,101.8 MT. Average production of yellow corn amounted to 91.5 percent. The biggest of which was recorded in 2017 with 224,962 MT while the lowest was in 2010 with 156,518 MT. The 8.5 percent remainder was the average contribution of white corn to the total production for the span of 11 years.
Figure 3. Area Planted/Harvested and Volume of Production of
Yellow Corn and White Corn, CAR: 2008 to 2018
- For four-legged animals, commercial farms are those that satisfy one of the following: (a) at least 21 adults and zero young; (b) at least 41 heads of young animals; and (c) at least 10 heads of adults and 22 heads of young animals.
- For poultry, a commercial farm should satisfy any of the following criteria: (a) 500 layers or 1000 broilers; (b) 100 layers and 100 broilers if raised in combination; and (c) 100 heads of ducks regardless of age. Backyard farms refer to those that do not fall in the category of commercial farming.
Swine has the biggest inventory of livestock
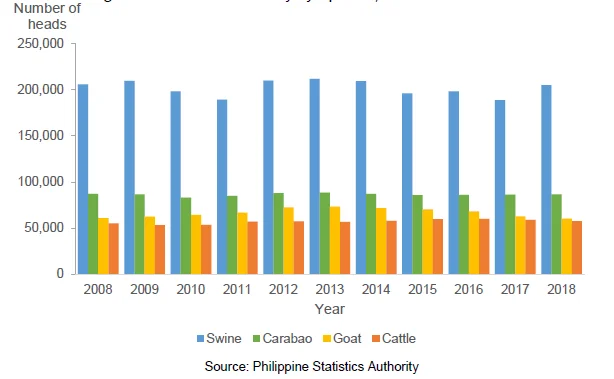
- Based on the statistics gathered, swine had the biggest number of livestock ranging from 188,937 heads (2017) to 211,886 heads (2013) with 98.2 percent raised in backyard farms and 1.2 percent raised in commercial farms (2018). Inventory of cattle posted the least number with only 60,364 maximum counted head in 2016, majority was raised in backyard farms (86.7 percent). Likewise, most of the carabaos and goats were raised in backyard farms.
Figure 4. Livestock Inventory by Species, CAR: 2008 to 2018
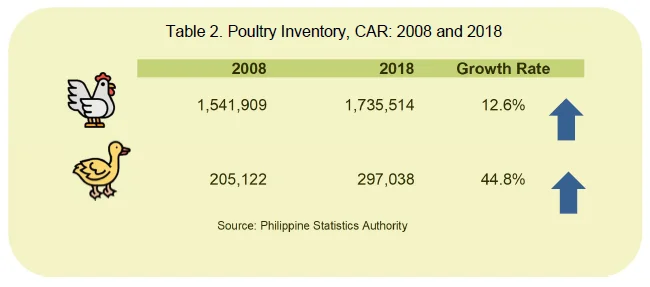
Chicken and duck inventories both increased by 12.6% and 44.8%, respectively
- Chicken inventory posted the highest in 2011 with 1.8 million heads, most of which were native/improved. The inventory of chicken went up by 12.6 percent from 1,541,909 birds in 2008 to 1,735,514 birds in 2018.
- For the inventory of ducks, the highest posted in 2018 with 297,038 heads, all were raised in backyard farms. Inventory of ducks also grew by 44.8 percent from 205,122 birds in 2008 to 297,038 birds in 2018.
