Environmental Resources and Their Use is one of the six components of the United Nations Framework for the Development of Environment Statistics (FDES) 2013. This framework was adopted in the Cordillera Administrative Region (CAR) to come up with CAR Regional Compendium of Environment Statistics. Component 2 has four subcomponents, one of which is Mineral Resources.
- Minerals are defined as the “elements or compounds composed of a concentration of naturally occurring solid, liquid or gaseous materials in or on the earth’s crust.” Minerals are categorized into two, namely metallic and non-metallic minerals.
- Metallic minerals include gold, silver and copper, and non-metallic minerals include precious gems, sand and clay. By definition, coal and petroleum resources are also considered as non-metallic minerals, but due to their capacity to provide energy, they are included in Energy Resources.
- Mineral resources are non-renewable. They do not regenerate on any human timescale. This implies that the rate at which they are extracted is also the rate of their depletion. Since they cannot be renewed, sustainable use of these resources must be practiced by the industries engaged in mining.
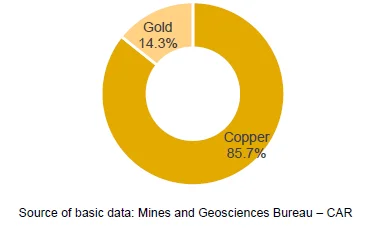
Copper is 86% of the total metallic mineral reserves
- Cordillera region has two prime commodities of metallic mineral reserves – gold and copper. According to the 2018 Annual Mineral Resources/Reserves Inventory, CAR had 69.6 million tons of metallic mineral reserves of which 85.7 percent or 59.7 million metric tons were copper and 14.3 percent or 9.9 million metric tons were gold.
Figure 1. Percentage Distribution of Metallic Mineral Reserve, CAR: 2018

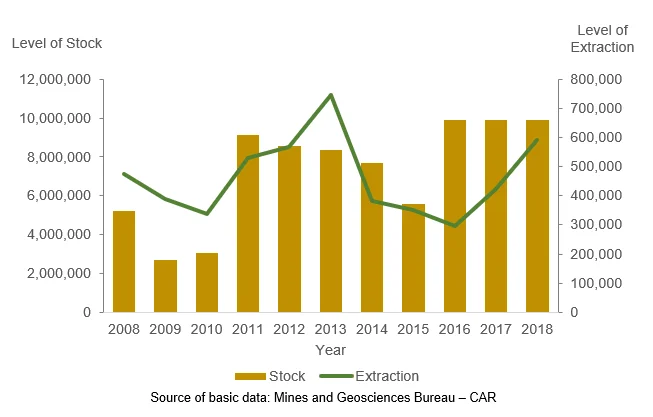
Extraction of gold reserves highest in 2013 with 745 thousand MT
- Stock of gold reserves increased from 5.2 million metric tons in 2008 to 9.9 million metric tons in 2018. This represents an annual average growth of 20.0 percent or annual increase of 473,437 metric tons. The average rate of extraction for gold reserves was estimated at 462,491 MT from 2008 to 2018.
Figure 2. Stock of Commercially Recoverable Gold Resources and Extraction,
CAR: 2008-2018 (In metric tons)

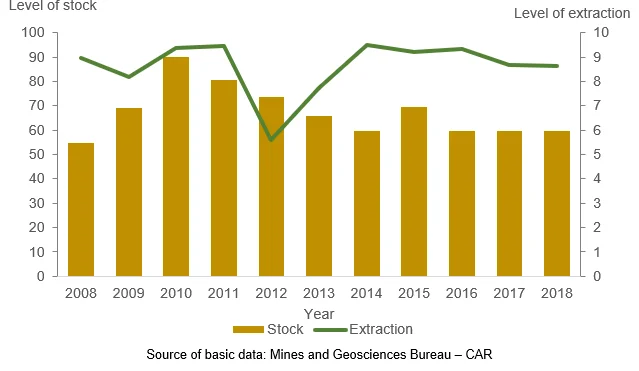
Copper reserves highest in 2010 with 90 million MT
- Level of stock of copper reserves gradually increased from 54.7 million metric tons in 2008 to 59.7 million metric tons in 2018, representing an annual average growth of 2.0 percent or 500 thousand metric tons yearly increment. Extraction, on the other hand posted an average of 8.6 million MT for the same period.
Figure 3. Stock of Commercially Recoverable Copper Resources and Extraction,
CAR: 2008-2018 (In million metric tons)

Limestone is 99.4% of the total non-metallic mineral reserves
- Non-metallic minerals in the region is mostly limestone. The inventory showed that 99.4 percent of the total 139.9 million metric tons of non-metallic mineral are limestone. The remainder represents the sand and gravel reserves.
Table 1. Nonmetallic Minerals Resource/Reserve Inventory, CAR: 2008-2018 (In tons)
| Year | Sand and Gravel | Limestone |
|---|---|---|
| 2008 | 977,815.0 | 150,253,447.0 |
| 2009 | 943,700.0 | 150,253,447.0 |
| 2010 | 907,500.0 | 150,253,447.0 |
| 2011 | 1,080,650.7 | 150,253,447.0 |
| 2012 | 1,042,209.0 | 150,253,447.0 |
| 2013 | 984,383.8 | 150,253,447.0 |
| 2014 | 940,712.7 | 140,314,311.0 |
| 2015 | 1,343,713.8 | 139,778,579.0 |
| 2016 | 835,632.8 | 139,146,383.6 |
| 2017 | 850,092.7 | 139,145,887.5 |
| 2018 | 802,889.5 | 139,135,643.8 |
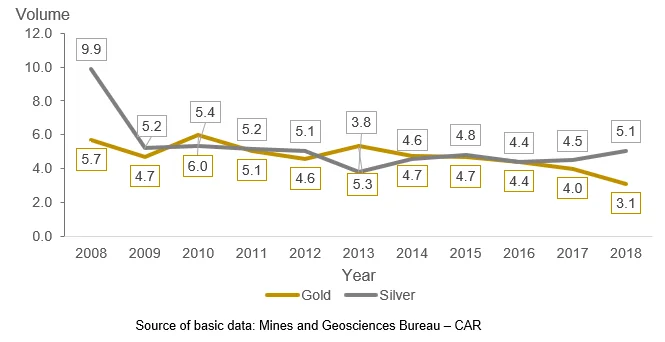
Production of gold and silver decrease from 2008 to 2018
- Gold and silver production displayed an overall downtrend from 2008 to 2018. Gold posted an annual average decline of 4.8 percent from 5.7 thousand kilograms in 2008 to 3.1 thousand kilograms in 2018. The highest production was in 2010 with 6.0 thousand kilograms and the lowest was in 2018 with 3.1 thousand kilograms.
- Silver decreased by an annual average of 4.3 percent from 9.9 thousand kilograms in 2008 to 5.1 thousand kilograms in 2018. The highest production was in 2008 with 9.9 thousand kilograms and the lowest was in 2013 with 3.8 thousand kilograms.
Figure 4. Volume of Production of Gold and Silver, CAR: 2008-2018 (In thousand kilograms)

Sand and gravel production largest in 2017 with 1 million cubic meters
- The lowest production of sand and gravel was recorded in 2008 with 161,767.5 cubic meters and the highest was in 2017 with 1.0 million cubic meters. The annual average production of sand and gravel in CAR was at 393,716.4 cubic meters for the period 2008 to 2018.
- Production increased from 161,767.5 cubic meters in 2008 to 514,406.0 cubic meters in 2018, an annual average growth of 17.6 percent or 35,263.9 cubic meters yearly increase.
- The lowest value of production was in 2008 with PHP28.2 million and the highest was in 2017 with PHP517.2 million. The value of production sloped upward with annual average growth of 47.2 percent.
Table 2. Sand and Gravel Production, CAR: 2004-2016
| Year | Sand and Gravel | Limestone |
|---|---|---|
| 2008 | 977,815.0 | 150,253,447.0 |
| 2009 | 943,700.0 | 150,253,447.0 |
| 2010 | 907,500.0 | 150,253,447.0 |
| 2011 | 1,080,650.7 | 150,253,447.0 |
| 2012 | 1,042,209.0 | 150,253,447.0 |
| 2013 | 984,383.8 | 150,253,447.0 |
| 2014 | 940,712.7 | 140,314,311.0 |
| 2015 | 1,343,713.8 | 139,778,579.0 |
| 2016 | 835,632.8 | 139,146,383.6 |
| 2017 | 850,092.7 | 139,145,887.5 |
| 2018 | 802,889.5 | 139,135,643.8 |
Production value of quicklime highest in 2018 with ₱92.2 million
- The lowest production of quicklime was recorded in 2009 at 7,375.4 MT and the highest was in 2014 at 9,770.3 MT. On the average, quicklime produced 8,664.8 MT for the 11-year period. In terms of value, the lowest was also seen in 2009 at PHP49.4 million. Meanwhile, the highest estimated value was recorded in 2018 at PHP92.2 million.
Table 3. Quicklime Production, CAR: 2004-2016
| Year | Quicklime | Slick Lime | ||
|---|---|---|---|---|
| Quantity (MT) | Value (PHP) | Quantity (MT) | Value (PHP) | |
| 2008 | 9,347.4 | 64,715,772.5 | 205.1 | 1,230,584.5 |
| 2009 | 7,375.4 | 49,415,233.6 | 312.0 | 1,708,090.8 |
| 2010 | 7,422.4 | 50,001,827.1 | 312.4 | 1,710,280.5 |
| 2011 | 8,171.3 | 55,102,046.2 | 383.1 | 2,097,176.8 |
| 2012 | 8,678.8 | 58,147,946.6 | 461.1 | 2,524,520.0 |
| 2013 | 9,070.1 | 60,770,125.0 | 33.1 | 181,420.1 |
| 2014 | 9,770.3 | 65,461,049.4 | 123.8 | 677,646.2 |
| 2015 | 7,848.1 | 59,069,664.5 | 53.5 | 327,575.1 |
| 2016 | 9,253.8 | 76,744,197.9 | 35.9 | 205,213.2 |
| 2017 | 9,380.1 | 76,205,755.4 | 54.0 | 350,283.7 |
| 2018 | 8,995.0 | 92,184,172.1 | 1,672.0 | 15,275,017.6 |

