

Release Date :
Reference Number :
SSR-2023-12
The physical flow accounts for water resources describe the flows of water to and from the environment and the economy. The accounts cover the entire process of water supply and use – from the initial abstraction of water from the environment into the economy, to the flows within the economy done by the different industries and households, and finally return flows from the economy back to the environment.
Scope and Coverage
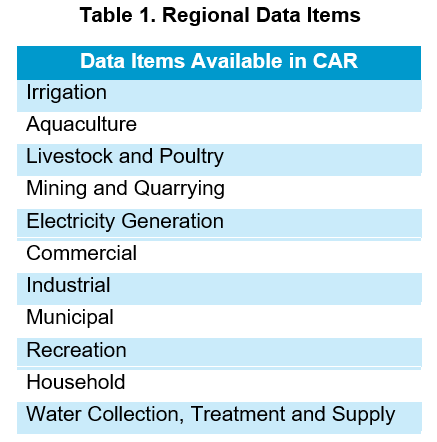
The study derived eleven categories where the flow of water goes – from the source to the intended destination. These categories are based on how the water was intended to be utilized. These records were disaggregated as follows:
Data Limitation
Physical flow accounting focuses on the amount of abstracted water from the environment, how the water was utilized in the economy, and the amount of water that returned to the environment from the economy.
Abstractions, as recorded by the National Water Resources Board – Cordillera Administrative Region (NWRB-CAR), applied by an individual or corporation should be limited to the allowable abstraction set by the agency. However, since there is no actual way to monitor these abstractions, it was assumed that abstractions can go under and beyond the allowable abstraction. Therefore, abstractions in this study were limited to the registered individual or corporation with their granted volume of abstraction.
Results and Discussion
The System of Environmental-Economic Accounting Central Framework (SEEA-CF) describes three types of flows. These are: flows from the environment to the economy; flows within the economy; and flows from the economy to the environment. With the available data, flows from the environment to the economy were broadly covered in this study, illustrating the sectors and industries utilizing the abstracted water from the environment.
Flows from the environment to the economy covers five major sector/industry/district according to the usage of abstracted water, namely: Agriculture, Forestry, and Fishing (subdivided into Irrigation, Fishing, and Livestock), Mining and Quarrying, Electricity Generation, Others (subdivided into Commercial, Industrial, Municipal, and Recreation), and Water Supply.
From the Environment to the Economy
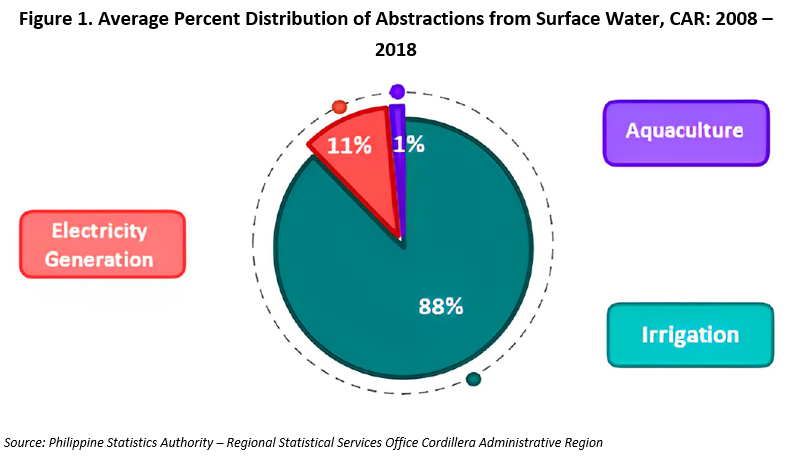
As seen in figure 1, Irrigation posted the highest abstraction from surface water with an average of 88%. Electricity generation followed with 11% and Aquaculture with 1%. The remaining industries had minimal abstractions.
From the Economy back to the Environment
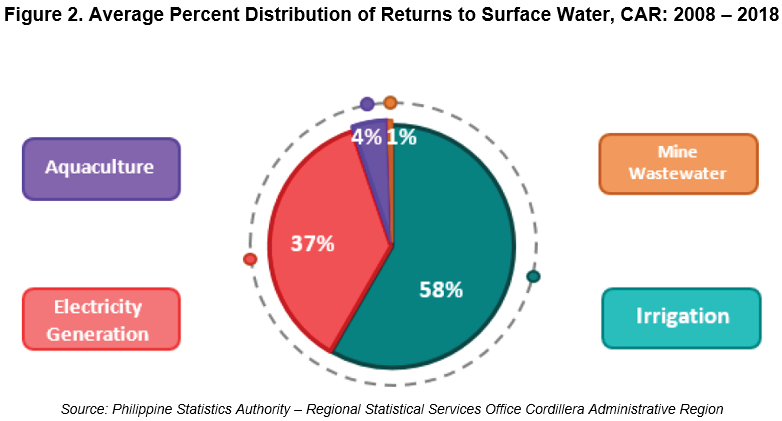
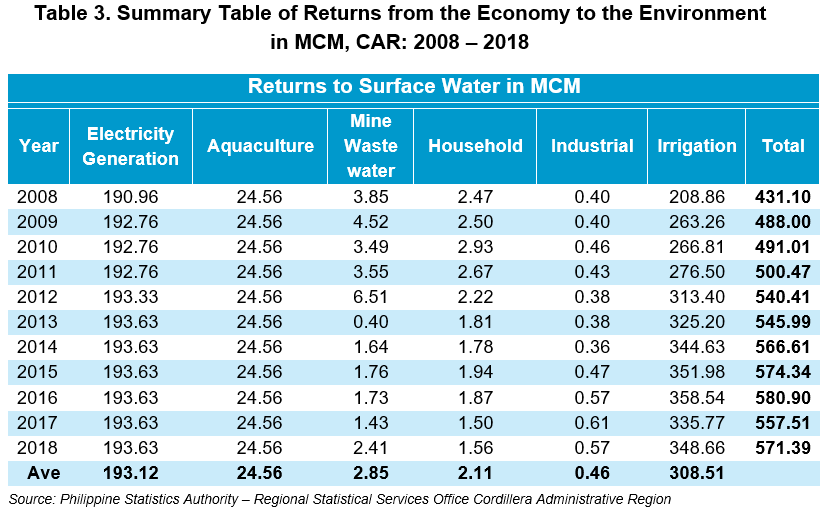
Figure 2 shows the average percent distribution of returns to surface water. Returns from Irrigation had the highest return with 58% share to the total returns, equal to 308.51 MCM. Returns from Electricity Generation followed with 37% at an average return of 193.12 MCM. Aquaculture and Mine Wastewater came next with an average return of 25.56 MCM and 2.85 MCM, respectively, equal to 4% and 1% contribution to the total returns. Household and Industrial yielded minimal returns.
Conclusion
From the Environment to the Economy
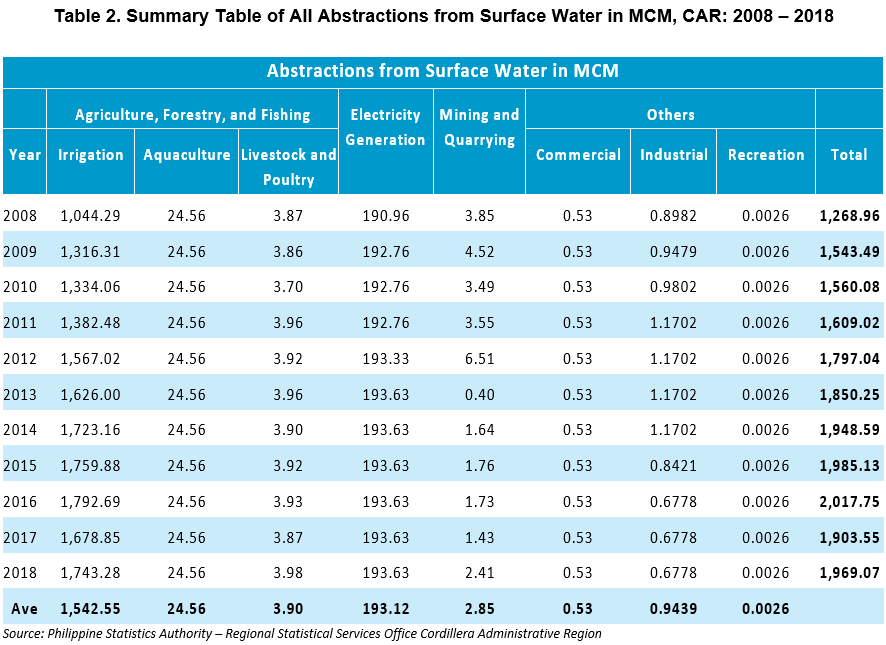
Total abstraction at the end of the accounting period amounted to 1.969.07 million cubic meters. These abstractions that went to different sectors in the economy, are as follows:
For Irrigation – Abstracted water from surface water amounted to 1.743.28 million cubic meters;
For Aquaculture – Aquaculture abstracted from surface water amounting to 24.56 million cubic meters;
For Livestock and Poultry – In 2018, abstractions from surface water for livestock and poultry recorded at 3.98 million cubic meters;
For Mining and Quarrying – Mining and quarrying sector abstracted an amount of 2.41 million cubic meters from surface water in 2018;
For Electric Generation – Abstracted water for electric generation from surface water posted 193.63 million cubic meters; and
For Others – In 2018, abstractions for others amounted to 1.21 million cubic meters.
From the Economy back to the Environment
Total returns at the end of the accounting period posted 571.39 million cubic meters that went to the surface water. These returns were attributed from the following:
From Industries – Wastewater from industries amounted to 0.57 million cubic meters;
From Households – Returns from households through sewerages posted 1.56 million cubic meters;
From Electricity Generation – Electricity generation sector returned 193.63 million cubic meters;
From Aquaculture – In 2018, returns from fishing posted 24.56 million cubic meters; and
From Mining and Quarrying – Returns from mining and quarrying through mine tailings posted 2.41 million cubic meters.
VILLAFE P. ALIBUYOG
Regional Director
____________________________________________
TECHNICAL NOTES
Physical Flow Accounts is the recording of physical flows. The different physical flows – natural inputs, products and residuals – are placed within the structure of a physical supply and use table; and from this starting point, measurement of the physical flows can be expanded and reduced to enable focusing on a range of different materials or on specific flows.
Natural resources include all natural biological resources (including timber and aquatic resources), mineral and energy resources, soil resources and water resources.
Water Flow Accounts describe flows of water, in physical units, encompassing the initial abstraction of water resources from the environment into the economy, to the water flows within the economy in the form of supply and use by industries and households, and finally, flows of water back to the environment.
Abstraction is the idea of “removing” or “pulling away”, to extract.
Aquaculture is the cultivation of aquatic organisms (such as fish or shellfish) especially for food.
Irrigation is the watering of land by artificial means to foster plant growth.
Recreation is a way of refreshing the mind or body after work or worry.
National Water Resources Board is an attached agency of the Department of Environment and Natural Resources responsible for ensuring the exploitation, utilization, development, conservation and protection of the country’s water resource, consistent with the principles of “Integrated Water Resource Management”.
System of Environmental-Economic Accounting 2012 - Central Framework (SEEA Central Framework) is a statistical framework consisting of a comprehensive set of table and accounts, which guides the compilation of consistent and comparable statistics and indicators for policymaking, analysis and research.
Mining and Quarrying is the extraction of solid fuels, petroleum, natural gas, minerals, salt, construction stone, and sand and clay; including their associated areas (slag heaps, dumps and storage areas, loading and unloading sites, shafts or head gear).
Wastewater is defined as water that is of no further immediate value for the purpose for which it was used or in the pursuit of which it was produced, because of quality, quantity or time of its occurrence.
References:
United Nations (2014). System of Environmental-Economic Accounting 2012: Central Framework, United Nations, New York
Merriam-Webster Dictionary
| Attachment | Size |
|---|---|
|
|
457.64 KB |