Release Date :
Reference Number :
SR 2019-39
- Consumer Price Index (CPI) is the general measure of the change in the average retail prices of a market basket or collection of goods and services commonly purchased by the average Filipino household.
-
The CPI of the Cordillera Administrative Region (CAR) in October 2019 was 119.9. This was higher by 1.4 index points from the 118.5 CPI of October 2018 using 2012 as base year.
-
In general, the CPI increased reflecting the rise in the average prices of goods and services in all the six provinces of CAR.
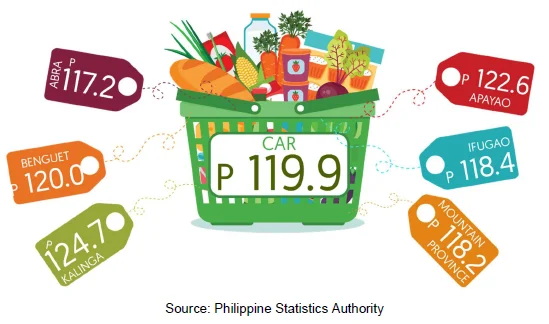
Figure 1. Consumer Price Index by Province, CAR:
October 2019 (2012=100)
-
Among the CAR provinces, Kalinga posted the highest CPI for October 2019 at 124.7, followed by Apayao at 122.6, and Benguet at 120.0 while Abra posted the lowest CPI at 117.2.
CPI by Commodity Groups
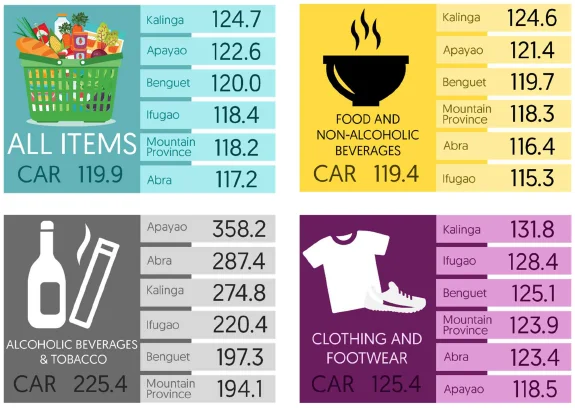
- Among the commodity groups, Alcoholic Beverages and Tobacco had the highest CPI in the region with 225.4. The province of Apayao incurred the highest CPI on this commodity with 358.2, followed by Abra, Kalinga, and Ifugao at 287.4, 274.8, and 220.4, respectively.
-
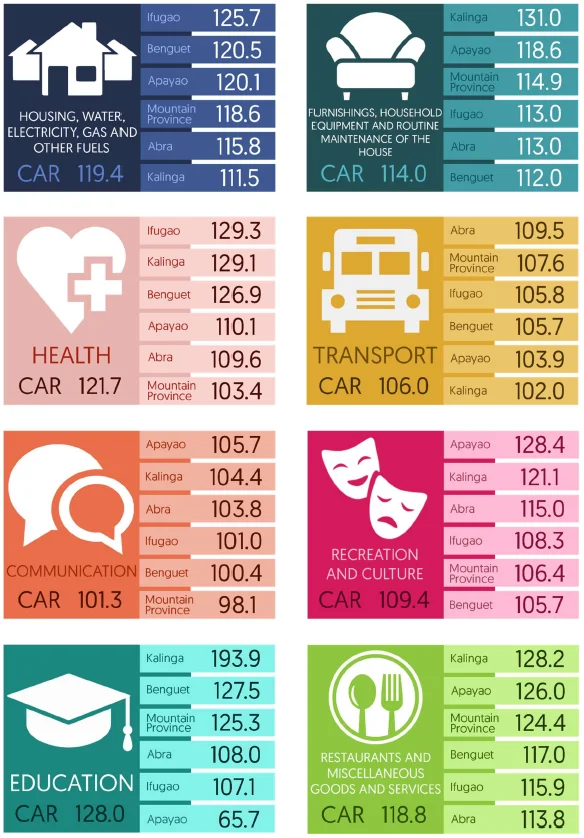
Education registered the second highest CPI among the commodity groups in the region for October 2019 at 128.0 index points. Among the provinces, Kalinga had the highest index on education at 193.9, while Apayao had the least at 65.7.
-
Clothing and Footwear ranked third at 125.4 index points. Kalinga recorded the highest index on clothing footwear at 131.8, followed by Ifugao and Benguet at 128.4 and 125.1 index points, respectively.
-
Communication continued to have the lowest CPI among the commodity groups in the region with 101.3 index points. The province of Apayao incurred the highest index on communication with 105.7 index points, while Mountain Province had the lowest with 98.1 index points.
-
Among the CAR provinces, Kalinga incurred the highest CPI for all items with 124.7, while Abra garnered the lowest index at 117.2 in October 2019.
Figure 2. Consumer Price Index by Commodity Group and by Province,
CAR: October 2019 (2012=100)
-
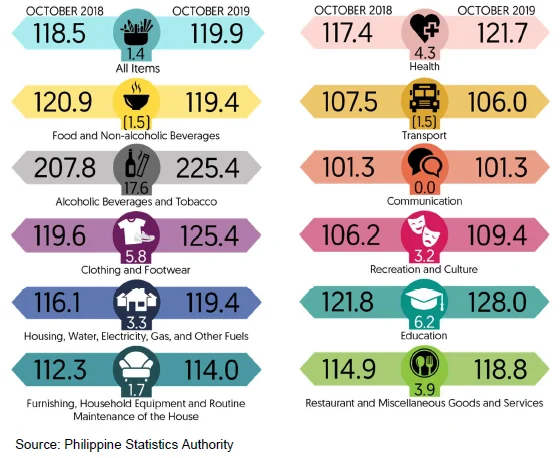
By index point change, Alcoholic Beverages and Tobacco recorded the highest increase at 17.6. Increases were also incurred in Education (6.2 points), Clothing and Footwear (5.8), and Health (4.3 points). The rest of the commodity groups reported minimal annual increases.
Figure 3. Year-on-Year Consumer Price Index by Commodity Group, CAR:
October 2018 and 2019 (2012=100)
Inflation Rate
-
The average increase in the prices of goods and services in the region slowed down to 1.2% in October 2019 from the 5.2 rate in October 2018.
-
Mountain Province posted the highest inflation rate in October 2019 at 4.0%, followed by Ifugao at 1.9%. Benguet incurred the lowest inflation with 0.4% among all provinces.
-
All the provinces had lower inflation rates in October 2019.
Figure 4. Year-on-Year Inflation Rates by Province, CAR:
October 2018 and 2019 (2012=100)
By Commodity Group
- Inflation rate of the heavily-weighted Food and Non-Alcoholic Beverages index in the region increased from the September 2019 rate of -1.5 to the -1.2 of October 2019.
- Alcoholic Beverages and Tobacco remained to have the highest inflation in October 2019 among other commodities in the region with 8.5%, followed by Education with 5.1 % and Clothing and Footwear with 4.8%.
- Among all other commodities, Transportation incurred the lowest inflation rate at -0.5%.
Figure 5. Inflation Rates by Commodity Groups, CAR: October 2019
(2012=100)
By Food Items, Year-on-Year
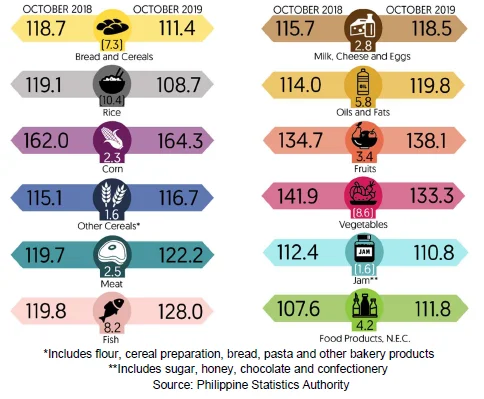
- Among the food items, Corn recorded the highest CPI in the region in October 2019 with 164.6. This was followed by Fruits, Vegetables and Fish with 138.1, 133.3, and 128.0 index points, respectively.
- By index point change, Fish recorded the highest increase by 8.2. Oil and Fats followed with a 5.8 index point increase followed by Fruits with 3.4.
-
Figure 6. Year-on-Year CPI and Inflation Rates of Selected Food Items,
CAR: October, Year 2018 and 2019 (2012=100)
Purchasing Power of the Peso (PPP)
- The value of the peso in the region was 83 centavos in October 2019. It dropped by one centavo from 84 centavos in October 2018. This means that one peso in 2012 is worth 83 centavos in October 2019.
- In other words, a basket of goods that can be bought with 100 pesos in December 2012 is worth 119.9 pesos in October 2019.
- The PPP in all the provinces generally weakened in October 2019 compared to the same month of the previous year.
-
Abra and Mountain Province had the highest peso value both at 85 centavos, followed by Ifugao at 84 centavo-peso value. Meanwhile, Kalinga had the lowest peso value at 80 centavos.
Figure 7. Purchasing Power of the Peso by Province, CAR:
October 2018 and 2019 (2012=100)


