

Release Date :
Reference Number :
24CAR32-834
Three out of seven persons were Never Married
Based on the 2020 Census of Population and Housing (2020 CPH), the Province of Kalinga had a household population of 229,328 persons. Of this total, the household population ten years old and over comprised 80.01 percent or 183,490 persons.
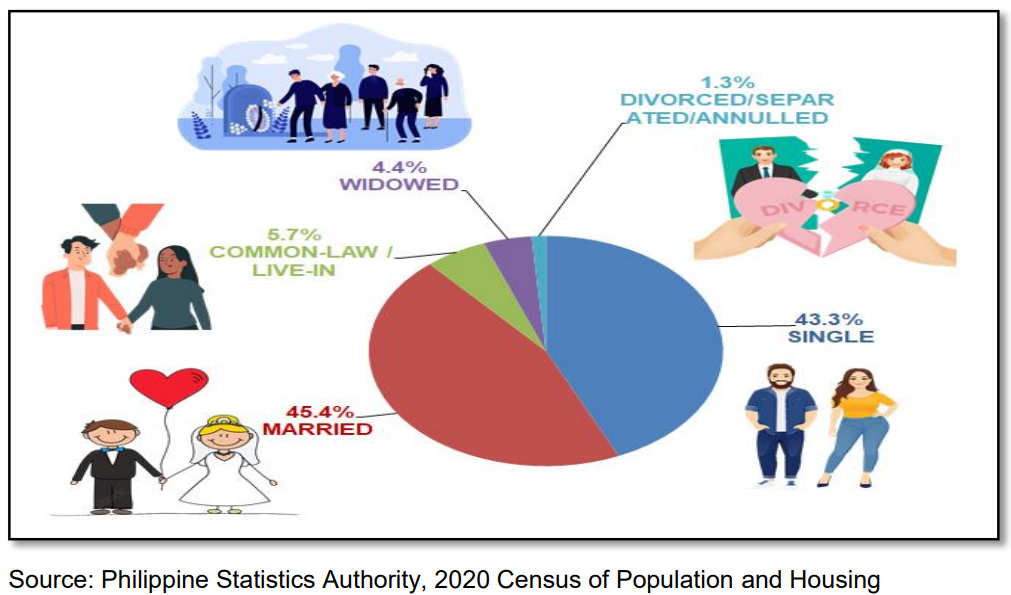
Of the 183.49 thousand persons aged ten years and over in 2020, 79,373 persons (43.3%) were never married, while 83,281 persons (45.4%) were married. The rest of the population was categorized as follows: in common-law/live-in marital arrangement with 5.7 percent, widowed with 4.4 percent, and divorced/separated/annulled with 1.3 percent. (Figure 1)
Figure 1: Percent Distribution of the Household Population 10 Years Old and Over by Marital Status: Kalinga,2020
Number of married persons increases by 6.27 thousand from 77.01 thousand in 2015 to 83.28 thousand in 2020 while couples in common-law/live-in marital arrangements increase by 3.3 percentage points.
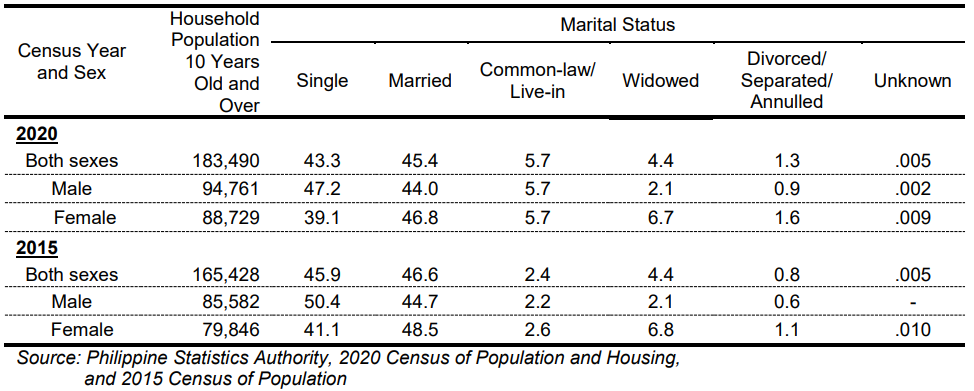
A decline of 2.6 percentage points in single or never-married persons was observed between 2015 and 2020 from 45.9 percent in 2015 to 43.3 percent in 2020. (Table 2)
The percentage of married persons in 2020 was very close to that in 2015. However, despite such close ratios, their number increased by 6,271 from 77,010 in 2015 to 83,281 in 2020. (Tables 1 and 2)
Among individuals in common-law/live-in marital arrangements, the percentage increased to 5.7 percent in 2020 from 2.4 percent in 2015. The same trend was observed among those divorced/separated/annulled, registering 1.3 percent in 2020 from 0.8 percent in 2015. On the other hand, the percentage of widows remained the same in 2015 and 2020 at 4.4 percent. (Table 2)
In terms of distribution by sex, 47.2 percent of households were composed of single men, while 39.1 percent were composed of single women. On the other hand, 44.0 percent of males and 46.8 percent of females were married. Similarly, 5.7 percent of males and 5.7 percent of females were in common-law/live-in marital arrangements. The remaining percentage was distributed between divorced and widowed, reaching 0.9 percent for divorced/separated/annulled males and 1.6 percent for their female counterparts. Meanwhile, the percentage of widowed males and females was 2.1 percent and 6.7 percent, respectively. (Table 2)
Table 1. Household Population 10 Years Old and Over by Sex and Marital Status: Kalinga, 2020 and 2015
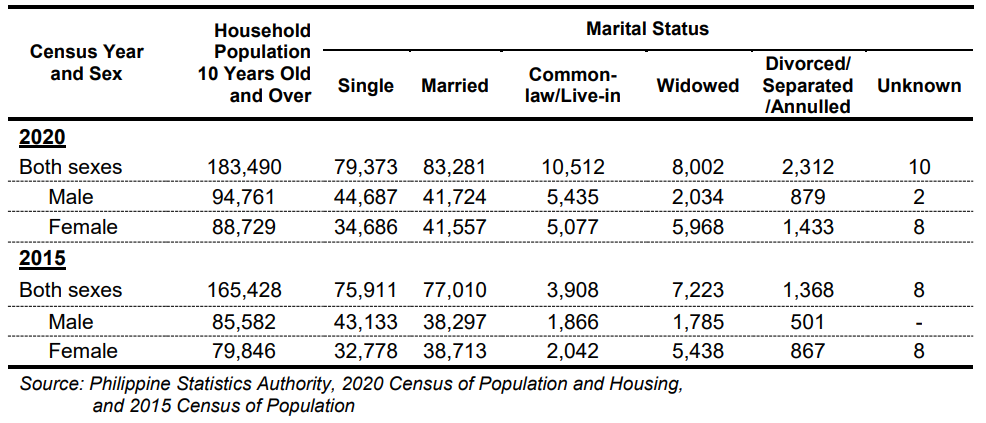
Table 2. Percent Distribution of Household Population 10 Years Old and Over by Sex and Marital Status: Kalinga, 2020 and 2015
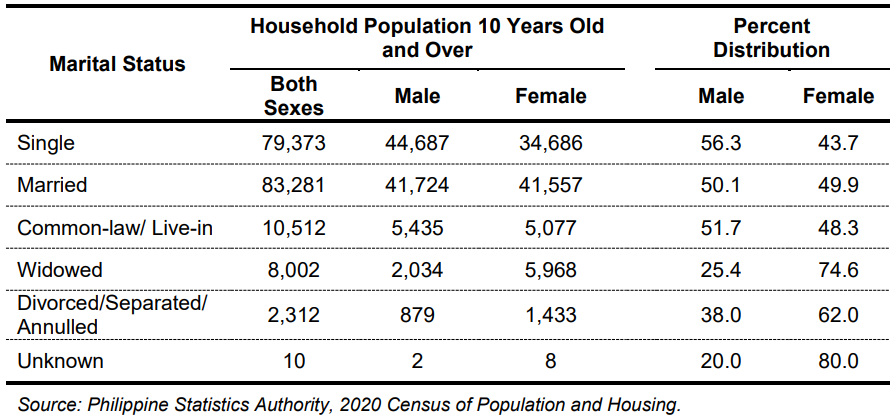
There are more males than females among the never-married persons, married persons, and common-law/live-in marital arrangements.
Among the never-married persons, a higher proportion of males (56.3%) were reported in 2020. The same trend was observed among married persons and those in common-law/live-in marital arrangements with 50.1 percent and 51.7 percent, respectively. (Table 3)
Meanwhile, the proportion of females was higher than males among widowed (74.6%) and divorced/separated/annulled (62.0%). (Table 3)
Table 3. Number and Percent Distribution of Male and Female Household Population 10 Years Old and Over by Marital Status: Kalinga, 2020
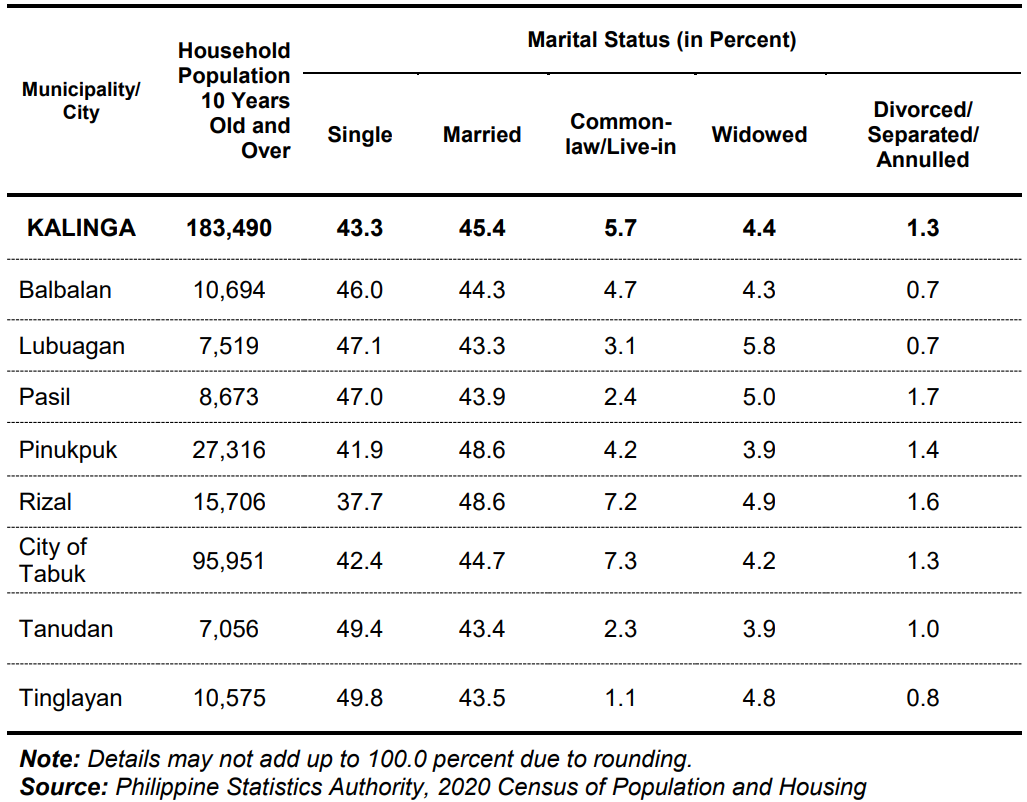
The Municipality of Tinglayan posts the highest proportion of single individuals; the Municipality of Pinukpuk and Rizal for married individuals.
By city/municipality, the proportion of single or never-married individuals was highest in the Municipality of Tinglayan at 49.8 percent. This was followed by the Municipality of Tanudan with 49.4 percent and the Municipality of Lubuagan with 47.1 percent. Meanwhile, the Municipality of Rizal posted the lowest proportion of never-married individuals at 37.7 percent. (Table 4)
Similarly, the Municipality of Rizal and Pinukpuk posted the highest proportion of married persons at 48.6 percent. This was followed by the City of Tabuk with 44.7 percent, Municipality of Balbalan with 44.3 percent, Municipality of Pasil with 43.9 percent, and the Municipality of Tinglayan with 43.5 percent. The lowest proportion of married persons, on the other hand, was observed in the Municipality of Lubuagan at 43.3 percent. (Table 4)
Common-law/live-in marital arrangements are most prevalent in the City of Tabuk while divorced/separated/annulled are most prevalent in the Municipality of Pasil. The proportion of widowed is highest in the Municipality of Lubuagan.
The proportion of persons in common-law/live-in marital arrangements was highest in the City of Tabuk at 7.3 percent, followed by the Municipality of Rizal at 7.2 percent, and the Municipality of Balbalan at 4.7 percent. The lowest proportion was in the Municipality of Tinglayan with 1.1 percent. (Table 4)
Meanwhile, the prevalence of divorced/separated/annulled individuals was highest in the Municipality of Pasil at 1.7 percent. (Table 4)
On the other hand, the proportion of widowed persons was highest in the Municipality of Lubuagan at 5.8 percent, followed by the Municipality of Pasil with 5.0 percent, and the Municipality of Rizal with 4.9 percent. The lowest proportion of widowed persons was in the Municipalities of Pinukpuk and Tanudan with 3.9 percent each. (Table 4)
Table 4. Distribution of Household Population 10 Years Old and Over by Marital Status, and Municipality/City: Kalinga, 2020
Four in every seven persons aged 30-54 years are married
Among married persons, 58.16 percent were aged 30-54 years, broken down with the following age groups: 30-34 years with 13.01 percent, 35-39 years with 12.55 percent, 40-44 years with 12.07 percent, 45-49 years with 10.78 percent, and 50-54 years with 9.73 percent. (Figure 2)
Among married males, the highest proportion was reported in the age group 30-34 years with 6.42 percent. Similarly, married females had a higher proportion among age group 30-34 years with 6.58 percent. (Figure 2)
Figure 2. Percent Distribution of Married and Common-Law/ Live-in Household Population 10 Years Old and Over: Kalinga, 2020

Among the age groups of individuals in common-law/live-in arrangements, the highest proportion was reported in age group 20-24 years with 22.23 percent. The highest proportion was reported in the age group 25-29 among males with 11.69 percent while in the age group 20-24 among females with 12.46 percent. (Figure 2)
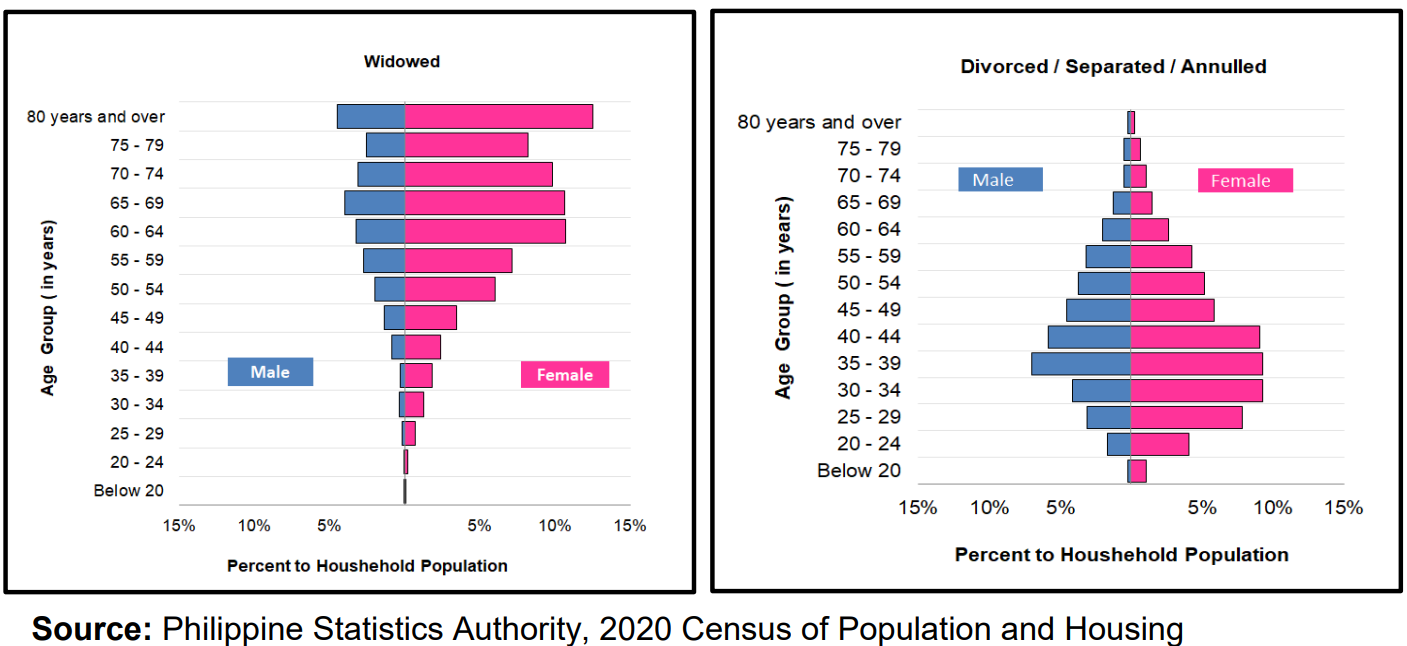
The proportion of persons reported as widowed was higher among females than males across all age groups. The same trend was observed among individuals who were divorced/separated/annulled. (Figure 3)
Figure 3. Percent Distribution of Widowed and Divorced/Separated/Annulled Household Population 10 Years Old and Over: Kalinga, 2020
The statistics presented in this report were based on the information provided by the respondent or any responsible household member who answered the questions and gave correct information about all the household members.
In the 2020 CPH, data on the marital status of every household member 10 years old and over were collected by asking the respondents, “Is single, married, common-law/live-in, widowed, or divorced/separated/annulled?”
sgd.
MARIBEL M. DALAYDAY
Chief Statistical Specialist
TECHNICAL NOTES
Marital Status
(2020 Census of Population and Housing)
I. Introduction
The Philippine Statistics Authority (PSA) conducted the 2020 Census of Population and Housing (2020 CPH) in September 2020, with 01 May 2020 as the reference date.
The 2020 CPH was the 15th census of population and the 7th census of housing undertaken in the Philippines since the first census in 1903. It was designed to take an inventory of the country's total population and housing units and collect information about their characteristics.
The Philippine Standard Geographic Code (PSGC), as of March 2022 was used to disaggregate geographic levels of the 2020 CPH.
II. Data Collection
Information on marital status contained in this report is based on the responses of the household respondents in the 2020 CPH. Hence, these may be different from the figures in the 2020 Vital Statistics Report released by the PSA, wherein the number of registered marriages refers to the actual registration of marriage certificates, as recorded by the Local Civil Registrars (LCRs) and transmitted to the PSA.
The statistics presented in this report were based on the information provided by the respondent or any responsible household member who may provide accurate answers to the questions and give correct information about all the household members; hence, it should be used with caution.
III. Methodology
The population and housing censuses in the Philippines are conducted on a “de jure” basis, wherein a person is counted in the usual place of residence or the place where the person usually resides. The enumeration of the population and collection of pertinent data in the 2020 CPH referred to all living persons as of 01 May 2020.
For the 2020 CPH, data on the Marital Status of every household member 10 years old and over were collected by asking the respondents, “Is _______ single, married, common-law/live-in, widowed, or divorced/ separated/annulled?”.
IV. Concepts and Definition of Terms
Household is a social unit consisting of a person or a group of persons who sleep in the same housing unit and have a common arrangement in the preparation and consumption of food.
Household population refers to all persons who are members of the household.
Household head is an adult member of the household, male or female, who is responsible for the organization and care of the household or who is regarded as such by the household members.
Sex is the biological and physiological reality of being a male or female.
Age refers to the interval between the person’s date of birth and his/her last birthday before the census reference date. It is expressed in completed years or whole numbers.
Marital status refers to the personal status of an individual in accordance with the marriage laws or customs of the country. It is the same as civil status, the term usually used in official and private records, documents, and transactions in the country. The person’s marital status shall be as of the date of visit.
The categories of marital status are as follows:
a. Single – a person who has never been married;
b. Married – a person married in a religious, civil ceremony or tribal rites, either living with his/her spouse at the time of visit or temporarily living apart because his/her spouse is employed elsewhere (as in the case of a person whose spouse is an overseas worker, or works in the Armed Forces and residing somewhere else);
c. Common-law/Live-in – a person cohabiting or living consensually with another person as husband and wife without the benefit of a legal marriage;
d. Divorced – a person who is permanently separated from his/her spouse, legally or through mutual consent; also applicable for a person whose marriage with another person has been annulled or dissolved and can, therefore, remarry; and
e. Unknown – a person whose marital status is unknown to the respondent or whose marital status is being concealed by the respondent/person himself/herself.