

Release Date :
Reference Number :
SSR 2023-19
-
Cordillera Administrative Region (CAR)
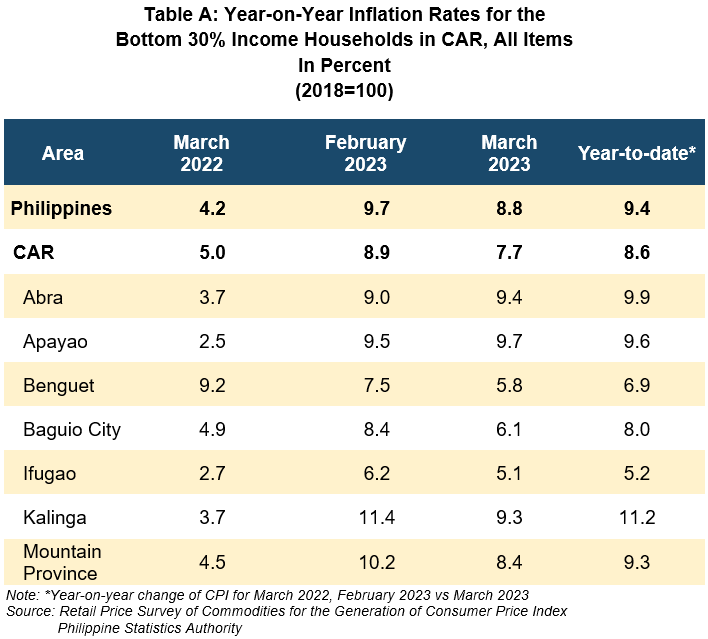
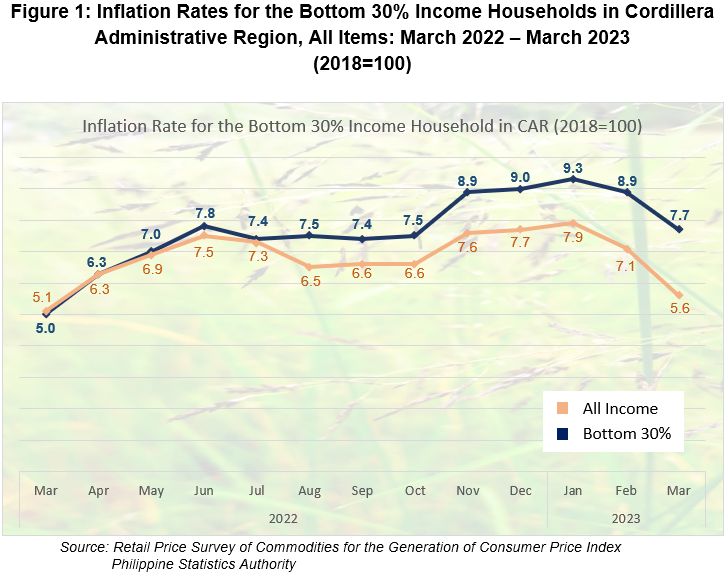
The inflation rate for the bottom 30% income households in Cordillera eased to 7.7 percent in March 2023 from 8.9 percent in February 2023. However, this was 2.1 percentage points higher than the all income inflation rate of 5.6 percent. Inflation for the bottom 30% in March 2022 was lower at 5.0 percent.
1.1 Main Drivers to the Downward Trend of Inflation
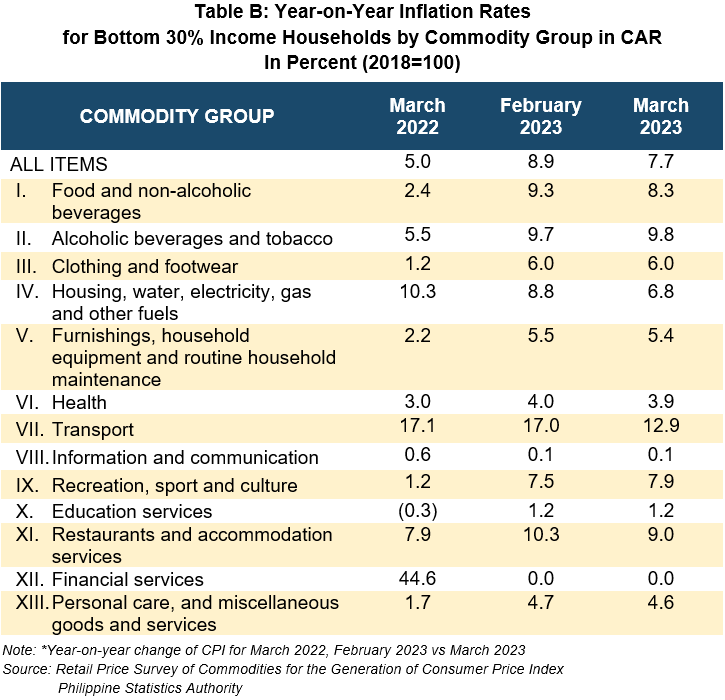
The downtrend was primarily brought about by the index of heavily-weighted food and non-alcoholic beverages at 8.3 percent, from 9.3 percent in February 2023. This was followed by the index of housing, water, electricity, gas and other fuels at 6.8 percent, from 8.8 percent in the previous month. The third primary driver of the downtrend of inflation during the month was the index of transport at 12.9 percent, from 17.0 percent in February 2023 (Table B and Figure 1).
Other commodity groups that contributed to the slower annual growth during the month were:
- Restaurants and accommodation services, 9.0 percent from 10.3 percent;
- Personal care, and miscellaneous goods and services, 4.6 percent from 4.7 percent;
- Health, 3.9 percent from 4.0 percent; and
- Furnishings, household equipment and routine household maintenance, 5.4 percent from 5.5 percent.
In contrast, two commodity groups registered higher inflation rates. These were the inflation of alcoholic beverages and tobacco at 9.8 percent from 9.7 percent in the previous month and the inflation of recreation, sport and culture, 7.9 percent from 7.5 percent.
Meanwhile, the inflation of the following commodity groups retained their previous month’s annual growth rates:
- Clothing and footwear, 6.0 percent;
- Information and communication, 0.1 percent;
- Educational services, 1.2 percent; and
- Financial services, 0.0 percent.
1.2 Main Contributors to the Bottom 30% Income Household Inflation
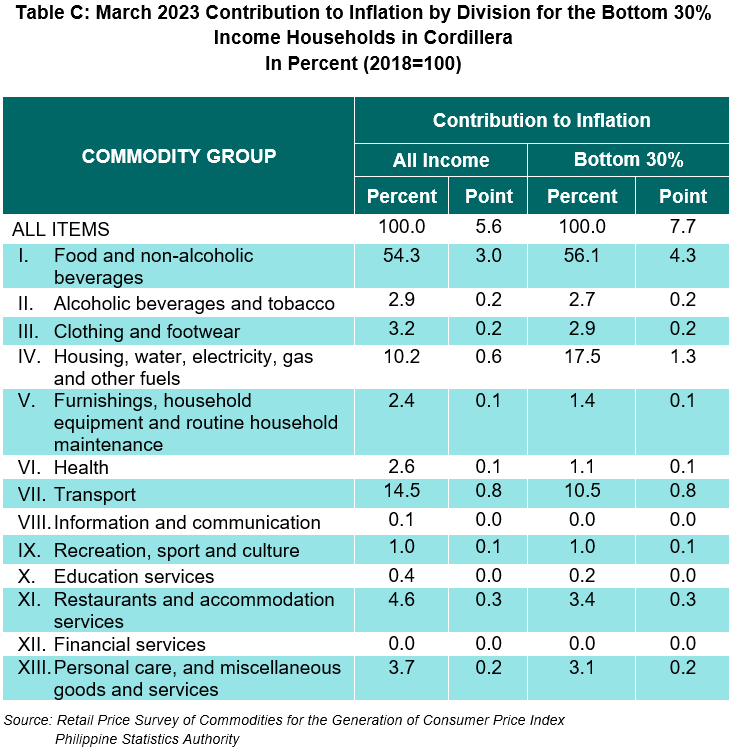
In terms of contribution to the March 2023 inflation rate, the top three commodity groups were the following:
a. Food and non-alcoholic beverages with 56.1 percent share or 4.3 percentage points;
b. Housing, water, electricity, gas and other fuels at 17.5 percent share or 1.3 percentage points; and
c. Transport at 14.5 percent share or 0.8 percentage points.
1. Provinces/ Highly Urbanized City (HUC) in CAR
Among the provinces and HUC, five registered deceleration in their inflation rates. Baguio City had the highest percentage point decrease of 2.3 from 8.4 percent in February 2023 to 6.1 percent in March 2023. This was followed by Kalinga with 2.1 percentage points decrease from 11.4 percent to 9.3 percent. In addition, the following also recorded lower inflation rates during the month of March 2023:
a. Mountain Province, 8.4 from 10.2 percent;
b. Benguet, 5.8 from 7.5 percent; and
c. Ifugao, 5.1 percent from 6.2 percent.
In contrast, two provinces registered higher inflation rates. The province of Abra increased by 0.4 percentage point from 9.0 percent inflation rate in February 2023 to 9.4 percent in March 2023. Apayao increased by 0.2 percentage point from 9.5 percent to 9.7 percent.
2. Food Inflation
Food inflation for the bottom 30% income household in Cordillera continued to slow down from 9.4 percent in February 2023 to 8.4 percent in March 2023. The food inflation was lower at 2.5 percent in March 2022 (Table D).
3.1 Main Drivers to the Downward Trend of Food Inflation
The primary driver of the lower food inflation was the lower annual growth in the index of Vegetables, tubers, plantains, cooking bananas and pulses with 23.6 percent from 34.7 percent in February 2023. This was followed by Sugar, confectionery and desserts with 48.9 percent from 52.8 percent, and Meat and other parts of slaughtered land animals with 4.0 percent from 4.3 percent in the previous month.
Lower inflation rates during the month were also noted in the indices of the following food items:
- Oils and fats, 10.3 percent from 11.3 percent;
- Corn, 8.3 percent from 9.2 percent; and
- Fish and other seafood, 6.0 percent from 6.1 percent.
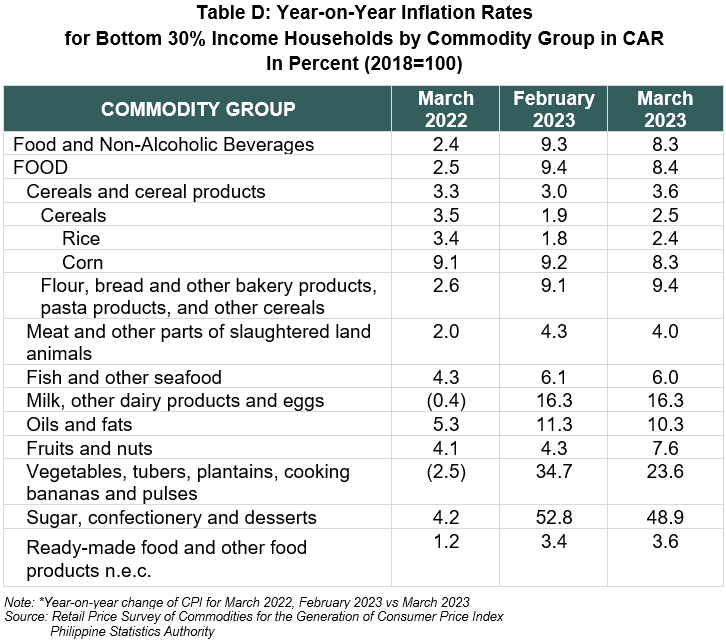
On the other hand, higher annual growth rates were registered in the following food groups:
- Rice, 2.4 percent from 1.8 percent;
- Flour, bread and other bakery products, pasta products, and other cereals, 9.4 percent from 9.1 percent;
- Fruits and nuts, 4.3 percent from 7.6 percent; and
- Ready-made food and other food products not elsewhere classified, 3.6 percent from 3.4 percent.
Meanwhile the index of Milk, other dairy products and eggs retained its previous month’s annual rate of 16.3 percent (Table D).
3.2 Main Contributors to the Food Inflation
In terms of contribution to the March 2023 overall inflation for the income group, food shared 56.1 percent or 4.3 percentage points. Among the food groups, the top contributors to food inflation were the following:
- Vegetables, tubers, plantains, cooking bananas and pulses, 30.5 percent share or 2.6 percentage points;
- Sugar, confectionery and desserts, 16.9 percent share or 1.4 percentage points; and
- Rice, 12.1 percent share or 1.0 percentage points.
Note: CPI and inflation rates by province and selected city are posted on the PSA website (http://openstat.psa.gov.ph).
(SGD)
ALDRIN FEDERICO R. BAHIT, JR.
(Chief Statistical Specialist)
Officer-in-Charge
| Attachment | Size |
|---|---|
|
|
376.28 KB |