

Release Date :
Consumer Price Index
- The Consumer Price Index (CPI) is the general measure of the change in the average retail prices of a market basket or collection of goods and services
commonly purchased by the average Filipino household. - The Consumer Price Index of CAR in June 2016 was recorded at 141.6 which is higher by 2.6 index points from last year’s 139.0.
- Generally, CPI increased in all the provinces reflecting the increase in the average prices of goods and services.
Table1. Consumer Price Index by Province, CAR:
June 2015 and June 2016
(2006=100)
| Province | June | Index Point Change | |
|---|---|---|---|
| 2015 | 2016 | ||
| CAR | 139.0 | 141.6 | 2.6 |
| Abra | 130.6 | 133.8 | 3.2 |
| Apayao | 129.6 | 131.1 | 1.5 |
| Benguet | 141.4 | 143.2 | 1.8 |
| Ifugao | 142.2 | 146.0 | 3.8 |
| Kalinga | 133.4 | 137.5 | 4.1 |
| Mt. Province | 146.5 | 151.4 | 4.9 |
Source: Philippine Statistics Authority
- Among the provinces in CAR, Mountain Province posted the highest CPI in 2016 at 151.4 followed by Ifugao at 146.0 and Benguet at 143.2. Apayao had the lowest CPI at 131.1.
- In terms of index point change, Mountain Province experienced the highest increase at 4.9, while Apayao had the least at 1.5.
Consumer Price Index by Commodity Groups
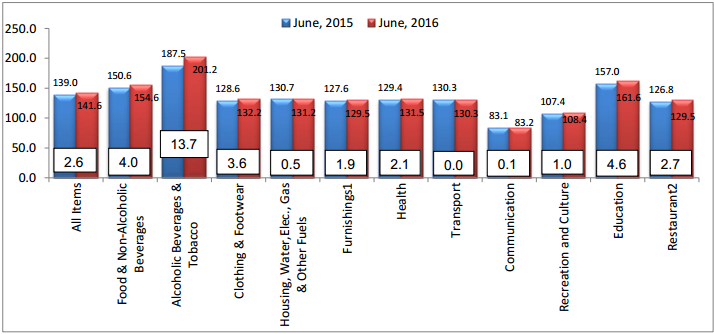
- Among the commodity groups, Alcoholic Beverages and Tobacco recorded the highest CPI at 201.2 in the region. Among the CAR provinces, Apayao incurred the highest at 220.2 followed by Abra and Kalinga at 208.9 and 207.2 index points, respectively.
- Education came next at 161.6 index points. Among the provinces, Mt. Province incurred the highest index for the month at 233.9 points.
- Food and Non-Alcoholic Beverages were at 154.6 index points with Benguet experiencing the highest at 160.4 followed by Mt. Province at 160.1.
- Communication had the lowest CPI among the commodity groups in the region with Abra having the highest index at 111.4; while Apayao had the lowest at 77.9 index points.
- Across provinces, Apayao posted the lowest index for all items.
Table2. Consumer Price Index by Commodity Group and by Province, CAR:
June 2016(2006=100)
| Commodity Group | Province | ||||||
|---|---|---|---|---|---|---|---|
| CAR | Abra | Apayao | Benguet | Ifugao | Kalinga | Mt. Province | |
| All Items | 141.6 | 133.8 | 131.1 | 143.2 | 146.0 | 137.5 | 151.4 |
|
Food and Non - Alcoholic |
154.6 | 133.8 | 131.1 | 143.2 | 146.0 | 137.5 | 151.4 |
|
Alcoholic Beverages and |
201.2 | 208.9 | 220.2 | 204.1 | 177.7 | 207.2 | 180.3 |
| Clothing and Footwear | 132.2 | 147.8 | 117.9 | 127.4 | 146.9 | 122.6 | 144.1 |
|
Housing, Water, Electricity, |
131.2 | 114.2 | 100.7 | 141.9 | 140.9 | 110.1 | 130.7 |
| Furnishing, Household Equipment and Routine Maintainance of the House |
129.5 | 124.0 | 114.7 | 133.5 | 117.8 | 136.4 | 135.0 |
| Health | 131.5 | 123.1 | 110.6 | 137.6 | 115.1 | 126.7 | 135.7 |
| Transport | 130.3 | 147.8 | 114.5 | 128.5 | 131.0 | 143.9 | 122.4 |
| Communication | 83.2 | 111.4 | 77.9 | 79.8 | 101.0 | 78.9 | 87.4 |
| Recreation and Culture | 108.4 | 108.9 | 116.2 | 105.5 | 106.5 | 114.9 | 113.1 |
| Education | 161.6 | 152.4 | 142.2 | 147.3 | 170.7 | 166.6 | 233.9 |
| Restaurants and Miscellaneous Goods and Services |
129.5 | 119.7 | 133.1 | 124.9 | 148.3 | 132.8 | 150.1 |
Source: Philippine Statistics Authority
- By index point change, Alcoholic Beverages and Tobacco recorded the highest change increasing at 13.7 points. Increases were also incurred for Education at 4.6 points, Food and Non-Alcoholic Beverages at 4.0 points, and Clothing and Footwear at 3.6 points.
- The rest of the commodity groups reported a minimal annual increase in their index points. On the other hand, Transport remained the same.
Figure 1. Year-on-Year Consumer Price Index by Commodity Group,
CAR: June 2015 and June 2016 (2006=100)
Note:
1. includes electricity, Gas & Other Fuels
2. includes Household Equipment and Routine Maintainance of the House
3. includes Miscellaneous Goods and Services
Source:Philippine Statistics Authority
Inflation Rate
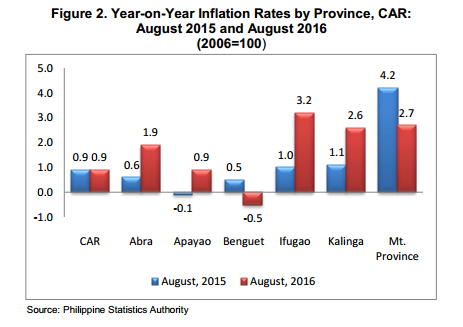
- For June 2016, prices of goods and services in CAR had increased by 1.9 percent, higher by 0.4 percentage points from the 1.5 percent last June 2015.
- Mt. Province posted the highest inflation with 3.3 percent, a decrease of 1.1 percentage points from last year’s 4.4 percent, followed by Kalinga, Ifugao and Abra with 3.1, 2.7 and 2.5 percent, respectively.
- As compared to last year, the rates of price also decreased in Apayao, and Benguet.
By Commodity Group, Year - on - Year
- By commodity, the year-on-year growth of the heavily-weighted Food and NonAlcoholic Beverages index in the Cordillera accelerated to 2.7 percent compared to 2.2 percent during the previous month.
- Inflation in Alcoholic Beverages & Tobacco is the highest in the region with 7.3 percent, followed by Education with 2.9 percent.
Table 3. Year-on-Year Inflation Rates by Commodity Groups,
CAR: June and May 2016 (2006 = 100)
| Commodity Group | Inflation Rates | |
|---|---|---|
| June 2016 | May 2016 | |
| All Items | 1.9 | 2.0 |
| Food and Non-Alcoholic Beverages | 2.7 | 2.0 |
| Alcoholic Beverages and Tobacco | 7.3 | 7.3 |
| Clothing and Footwear | 2.8 | 2.2 |
| Housing, Water, Electricity, Gas and Other Fuels | 0.4 | 0.8 |
| Furnishing, Household Equipment & Routine Maintenance of the House | 1.5 | 1.5 |
| Health | 1.6 | 1.5 |
| Transport | 0.0 | -0.2 |
| Communication | 0.1 | 0.1 |
| Recreation and Culture | 0.9 | 0.9 |
| Education | 2.9 | 8.5 |
| Restaurants and Miscellaneous Goods and Services | 2.1 | 2.3 |
By Food Items, Year - on - Year
- Generally, the year-on-year inflation rates modestly accelerated for all food items.
- Vegetables and Corn persisted to have the highest price increases in June 2016 with 13.3 and 7.6 percent.
- On the other hand, Milk, Cheese and Eggs, and Oils and Fats had the same inflation rate at 2.0 and 0.5 percent, respectively.
- Other Cereals, Meat, and Food Products, NEC continued to have a negative inflation rate at -0.3, -0.6 and -6.4 percent, respectively.
Table5. Year - on Year Inflation Rates of Selected Food Items, CAR:
June and May 2016 and 2015(2006=100)
| Food Items | 2016 | 2015 | Inflation Rates | |||
|---|---|---|---|---|---|---|
| Jun | May | June | May | Current | Previous | |
| Bread and Cereals | 153.6 | 153.7 | 151.2 | 151.1 | 1.6 | 1.7 |
| Rice | 150.1 | 150.2 | 147.0 | 146.8 | 2.1 | 2.3 |
| Corn | 169.8 | 172.7 | 157.8 | 157.4 | 7.6 | 9.7 |
| Other Cereals* | 165.0 | 164.9 | 165.5 | 165.4 | -0.3 | -0.3 |
| Meat | 132.1 | 132.3 | 132.9 | 132.7 | -0.6 | -0.3 |
| Fish | 173.1 | 173.3 | 165.3 | 163.9 | 4.7 | 5.7 |
| Milk, Cheese and Eggs | 137.1 | 137.1 | 134.4 | 134.4 | 2.0 | 2.0 |
| Oils and Fats | 180.2 | 180.2 | 179.3 | 179.3 | 0.5 | 0.5 |
| Fruits | 192.6 | 190.7 | 188.0 | 187.2 | 2.4 | 1.9 |
| Vegetables | 178.4 | 166.9 | 157.5 | 157.2 | 13.3 | 6.2 |
| Sugar, Jam, Honey, Chocolate & Confectionery | 138.5 | 138.2 | 133.6 | 133.4 | 3.7 | 3.6 |
| Food Products, N. E. C. | 164.0 | 164.1 | 175.3 | 171.9 | -6.4 | -4.5 |
Source: Philippine Statistics Authority
Purchasing Power of Peso (PPP)
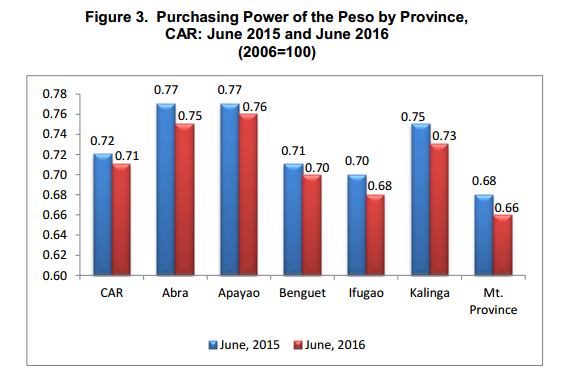
- The value of the peso in CAR dropped to 71 centavos from last year’s 72 centavos. This means that the market value of goods and services worth 71 centavos in June 2006 were bought at one peso in June 2016
- Compared to June 2015, the PPP of all the provinces decreased.
- Apayao had the highest peso value at 76 centavos, followed by Abra at 75 centavos and Kalinga at 73 centavos. Meanwhile, Mountain Province had the lowest peso value at 66 centavos..
Technical Notes
Consumer Price Index (CPI) is a general measure of the change in the average retail prices of a market basket or collection of goods and services commonly purchased by the average Filipino household.
Inflation Rate (IR) is the rate of change in the average price level between two periods (year-on year/month-on-month as measured by the CPI)
Purchasing Power of the Peso (PPP) measures how much the peso in the reference year is worth in another year
Base Year (BY) is the reference point of the index number series, at which the index number is set to zero.
Market Basket (MB) is a sample of goods and services used to represent all goods and services produced or bought.