

Release Date :
Reference Number :
: 2023-CARAP-SR14
Apayao Inflation Rate Decreased to 4.3 percent in July 2023
Table 1. Year-on-Year Inflation Rates in Apayao Province, All Items in Percent July 2023 (2018=100)
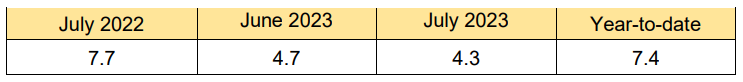
Source: Retail Price Survey of Commodities for the Generation of Consumer Price Index, Philippine Statistics Authority
The province’s inflation rate decreased to 4.4 percent in July 2023, lower by 0.3 percentage point compared with the same month of the previous year at 7.7 percent; and 0.4 percentage point lower than the previous month record of 4.7 percent. (Figure 1 and Table 1)
Figure 1. Year-on Year Inflation Rate, All Items in Percent, July 2022 – July 2023 (2018=100)
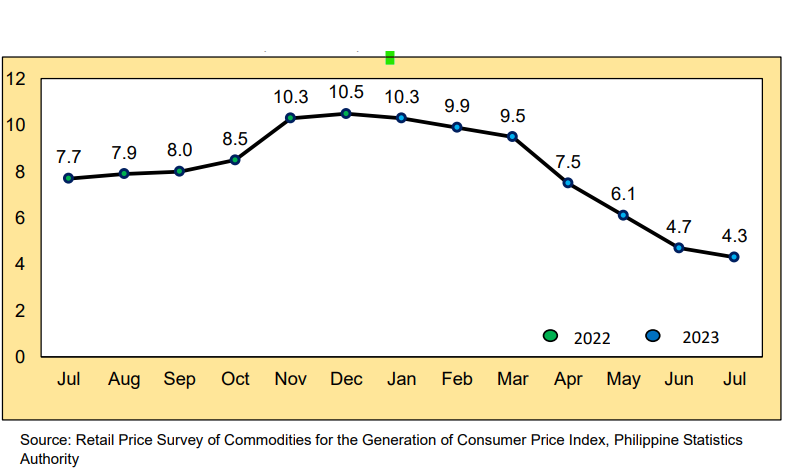
Table 2. Year-on-Year Inflation Rates in Apayao, By Commodity Groups in Percent (2018=100)
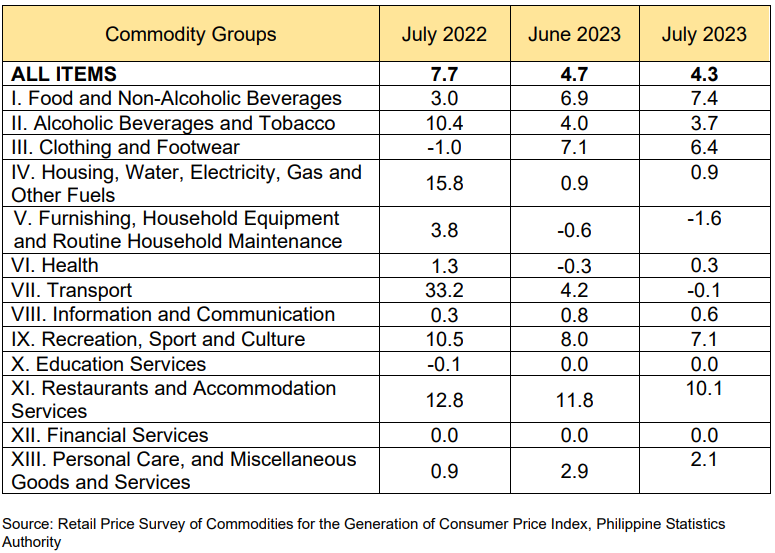
The main driver in the decrease of the province’s inflation rate in July 2023 was primarily due to the decrease in the index of the eight (8) commodity groups which are: 1) Transport with -0.1 percent and 72.7 % share; 2) Personal Care, and Miscellaneous Goods and Services with 2.1 percent and 7.5 % share; 3) Clothing and Footwear with 6.4 percent and 7.1 % share; 4) Furnishings, Household Equipment and Routine Household Maintenance with -1.6 percent and 5.9 % share; 5) Restaurants and Accommodation Services with 10.1 percent and 3.5 % share; 6) Recreation, Sport and Culture with 7.1 percent and 1.4 % share; 7) Alcoholic Beverages and Tobacco with 3.7 percent and 1.1 % share; and Information and Communication with 0.6 percent and 0.8 % share in the decrease of inflation. (Figure 2 and Table 2)
Moreover, the following commodity subgroups which had the highest percent share in the downtrend during the month of June are:
1. Other pelagic fish, live, fresh, chilled or froze with 14 percent;
2. Meat of poultry, fresh, chilled or frozen with 12.1 percent;
3. Cane sugar with 10.3 percent;
4. Gasoline (ND) with 8.2 percent;
5. Fuel wood, in logs, in billets, in twigs, in faggots or in similar forms with 7.7 percent;
6. Eggs of hen and other birds in shell, fresh with 6.5 percent;
7. Diesel (ND) with 5.6 percent;
8. Other passenger transport by road (S) with 4.2 percent;
9. Rentals actually paid by tenants or subtenants occupying unfurnished or furnished premises as their main residence with 3.8 percent;
10.Garments for men or boys (SD) with 2.8 percent;
11.Eggplants (augbergines), fresh or chilled with 2.2 percent;
12.Okra, fresh or chilled with 1.6 percent;
13.Pumpkins, squash or gourds, fresh or chilled with 1.6 percent;
14.Coconut oil with 1.4 percent; and
15.Mangoes, guavas and mangosteens, fresh with 1.3 percent
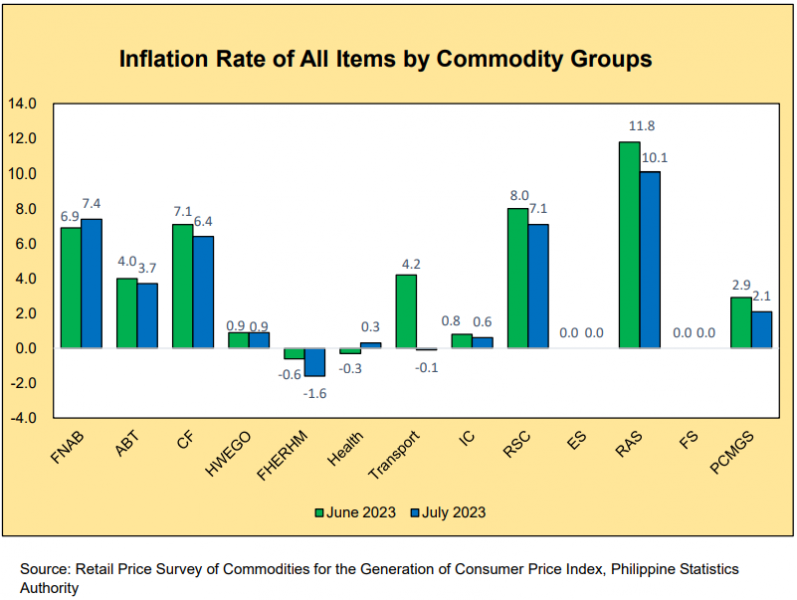
On the contrary, two (2) commodity groups increased in their inflation rate: Food and Non-Alcoholic Beverages by 0.5 percent; and Health by 0.4 percent. (Figure 2 and Table 2)
Meanwhile, the remaining commodity groups with constant inflation rate are: Housing, Water, Electricity, Gas and Other Fuels at 0.9 percent; and Education Services and Financial Services at 0.0 percent. (Figure 2 and Table 2)
Figure 2. Inflation Rate of All Items by Commodity Groups, Comparison Between June and July 2023
Purchasing Power of Peso (PPP) recorded at 0.83 in July 2023
Purchasing power of peso continue to weaken through the years and reached 0.83 in July 2023. The PPP of 0.83 implies that the Php1.00 in the base year 2018 values only Php 0.83 in July 2023. (Figure 3)
Figure 3. Purchasing Power of Peso in Apayao (2018=100): July 2018 - July 2023

DEFINITION OF TERMS
Consumer Price Index (CPI) measures the overall change in consumer prices based on a representative basket of goods and services over time.
Inflation refers to an overall increase in the Consumer Price Index (CPI), which is a weighted average of prices for different goods.
Purchasing power of the peso shows how much the peso in the base period is worth in the current period. It is computed as the reciprocal of the CPI for the period under review multiplied by 100.
Commodity Groups are group of goods and services found in the market basket of the province. There are thirteen (13) commodity groups which were arranged according to the PCOICOP.
PCOICOP a detailed classification of individual consumption expenditures on goods and services incurred by the three of the five (5) institutional sectors of the 1993 and 2008 System of National Accounts (SNA), namely: (a) households, (b) financial corporations, (c) non-financial corporations, (d) general government, and (e) non-profit institutions serving households. It stands for Philippine Classification of individual Consumption According to Purpose.
FNAB stands for Food and Non-Alcoholic Beverages
ABT stands for Alcoholic Beverages and Tobacco
CF stands for Clothing and Footwear
HWEGO stands for Housing, Water, Electricity, Gas, and Other Fuels
FHERHM stands for Furnishings, Household Equipment and Routine Household Maintenance
IC stands for Information and Communication
RSC stands for Recreation, Sport, and Culture
ES stands for Education Services
RAS stands for Restaurants and Accommodation Services
FS stands for Financial Services
PCMGS stands for Personal Care, Miscellaneous Goods and Services
Approved by:

GEOFFREY B. CALIMUHAYAN
Chief Statistical Specialist
/ LSBT
| Attachment | Size |
|---|---|
|
|
304.67 KB |