The Family Income and Expenditure Survey (FIES) is a nationwide survey of households undertaken every three years (every two years starting 2025) by the Philippine Statistics Authority (PSA). It is the main source of data on family income and expenditure, which include among others, levels of consumption by item of expenditure as well as sources of income in cash and in kind. The results of FIES provide information on the levels of living and disparities in income of Filipino families, as well as their spending patterns.
Average annual family income in CAR is 29.9 thousand pesos monthly
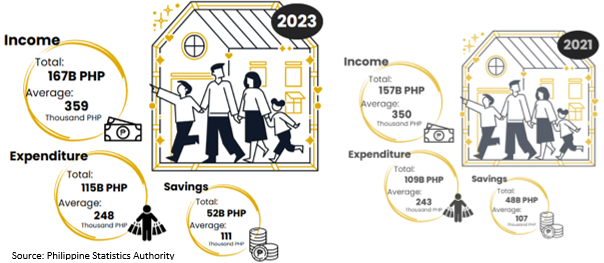
In 2023, families in the Cordillera Administrative Region (CAR) had an average annual family income of 359.24 thousand pesos. On the other hand, the annual expenditure for the same year was 247.86 thousand pesos on average. These figures meant an average annual saving of 111.38 thousand pesos per family.
Figure 1. Total and Average Annual Family Income and Expenditure,
CAR: 2021 and 2023

The region's average family income grew by 2.5% from 2021 to 2023, accompanied by a 2% rise in average annual expenditure during the same period. Additionally, average savings saw an increase of 3.6%.
Comparatively, the average annual family income and expenditure in the entire Philippines were 353.23 thousand pesos and 258.05 thousand pesos, respectively. This indicates that CAR's annual family income was 1.67% higher, while its average annual expenditure was 4.12% lower, reflecting the region's economic position relative to the national average.
When adjusted for inflation using 2018 prices, the average annual family income in CAR in 2021 was equivalent to 283.80 thousand pesos, while the average annual family expenditure amounted to 195.81 thousand pesos.
The richest have income more than 4 times that of the poorest and spend 2.5 times more than the poorest
Families were grouped and ranked into per capita income deciles. The richest decile represents the top 10% of families in terms of per capita income, while the poorest decile represents the bottom 10%.
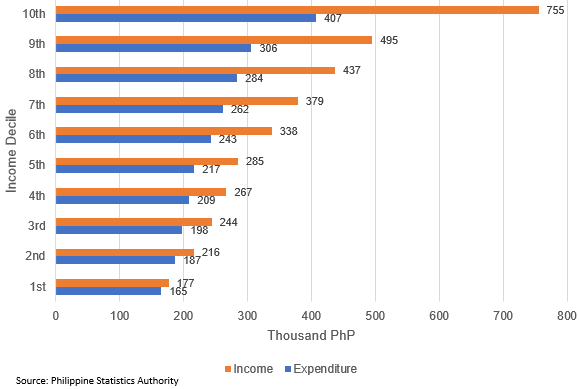
Figure 2: Mean Family Income and Expenditure by Per Capita Income Decile,
CAR: 2023

From 2021 to 2023, eight income deciles showed growth, with the 1st and 2nd deciles experiencing the highest growth rates at 26.0% and 20.3%, respectively. In contrast, the 9th decile saw a decline, decreasing from -7.7% in 2021 to -3.1% in 2023. The 10th decile experienced an even steeper drop, falling from -7.1% in 2021 to -21.9% in 2023.
In 2023, the mean family income in the region ranged from 176.56 thousand pesos for the 1st decile (poorest) to 755.17 thousand pesos for the 10th decile (richest). Mean expenditures ranged from 165 thousand pesos for the 1st decile to 407.15 thousand pesos for the 10th decile.
The average annual family income of the 10th decile in 2023 was more than four times higher than that of the 1st decile, while expenditures were nearly 2.5 times higher in the 10th decile compared to the 1st decile.
In terms of saving disparity, the 1st decile had only 11.56 thousand pesos in savings, as their income was nearly consumed by expenses. In contrast, the 10th decile saved significantly more, with 348.02 thousand pesos remaining from their income after expenditures, underscoring the significant financial gap between the poorest and richest households.
Salaries and entrepreneurial activities remain the highest income sources in the region
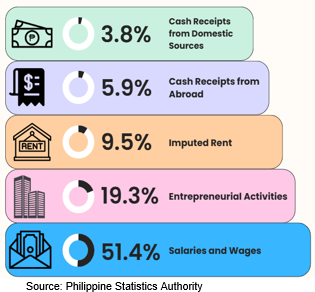
In 2023, more than half (51.4%) of the income across all income groups in the region came from Salaries and Wages, indicating that formal employment remains the primary source of income. Entrepreneurial activities contributed 19.3% of the total income, demonstrating the significant role of businesses and employment in the region's economy.Meanwhile, 9.5% of the total family income generated in the region came from Imputed Rent, reflecting its significant contribution to the overall
economic activity.

Another significant source of income came from Cash Receipts, with 5.9% coming from abroad and 3.8% from domestic sources, reflecting the role of these financial inflows in supporting household and community livelihoods.
Spending on house rental and utilities remains second to food expenses
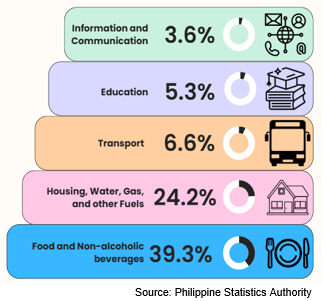
In 2023, more than one-third (39.3%) of total expenses across all income groups in the region were allocated to Food and Non-alcoholic Beverages, making it the largest expenditure category. Housing, water, gas, and other fuels followed at 15.6%, showing a significant portion of income spent on basic living expenses.
Expenditures on Transportation and Education accounted for 6.6% and 5.3%, respectively, indicating that these are also key areas of household spending in the region.

Information and Communication became a necessary expense, representing 3.6% of total family expenditure, reflecting its growing importance in daily life.
Moreover, poor families spent a larger share on education (4.9%) compared to Alcoholic beverages and tobacco, which made up just 1.4% of their total expenditure, emphasizing the prioritization of education over non-essential items.
(SGD)
VILLAFE P. ALIBUYOG
Regional Director
Technical Notes
The data for this publication were collected by PSA through the Family Income and Expenditure Survey (FIES).
Expenditure refers to the total amount spent by the household on goods, services, and other financial obligations during a specified period.
Income refers to the total money received by all household members from various sources, including wages, business profits, and transfers.
Inflation is a sustained increase in the general level of prices of goods and services.
Current Price is the price at which goods are currently being sold in the market.
Decile are groupings that result from ranking either all households or all persons in the population in ascending order according to income and then dividing the population into ten equal groups, each comprising approximately 10% of the estimated population.

