

Release Date :
Reference Number :
25CAR32-379
Kalinga’s production of corn decreased by 5.96 percent.
The total corn produced in Kalinga decreased by 5.96 percent from 20,043 metric
tons in the fourth quarter of 2023 to 18,849 metric tons in the same period of 2024. Almost 99 percent was produced from yellow corn and the remaining 1 percent from white corn.Figure 1. Corn Volume of Production (MT)by Corn Crop type in Kalinga,
Fourth Quarter 2023 and Fourth Quarter 2024 (in Metric Tons)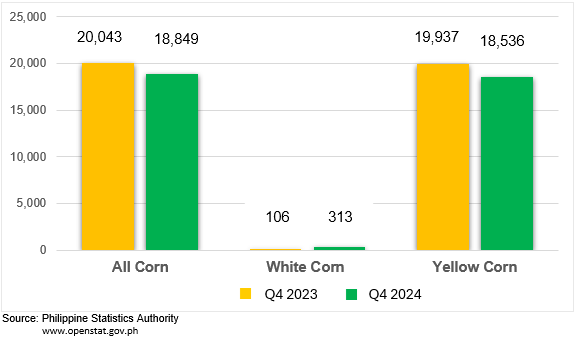
Total Area Harvested for corn grew by 8.71 percent
The total area harvested for corn grew by 8.71 percent during the fourth quarter of
2024 from 4,962 hectares in 2023 to 5,394 hectares. In both white and yellow corn circumstances, the area of harvested corn increased by 71 and 361 hectares, respectively.
Figure 2. Corn area Harvested (MT) by Ecosystem in Kalinga,
Fourth Quarter 2023 and Fourth Quarter 2024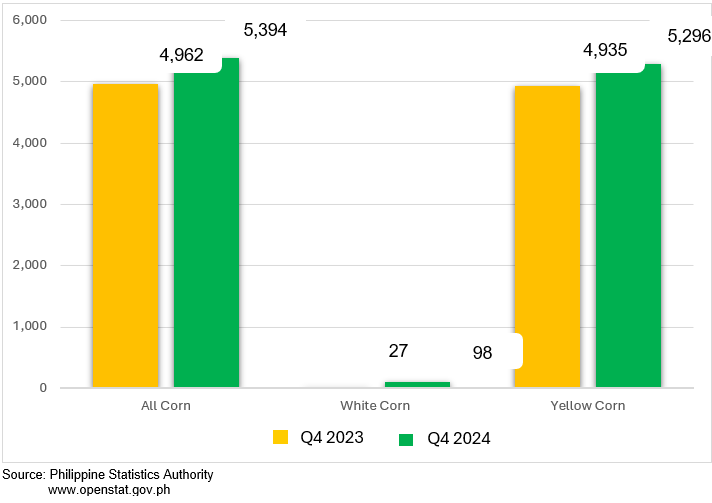
Corn Yield decreased by 13.61 percent.
Corn yield per hectare in Kalinga declined by 13.61 percent in the fourth quarter of 2024 compared to the same period in 2023. 3.49 metric tons in 2024 from 4.04 metric tons in the same quarter of 2023. Both circumstances, white and yellow corn showed a decline in the yield per hectare.
Figure 3. Corn per hectare (MT)by Crop type in Kalinga,
Fourth Quarter 2023 and Fourth Quarter 2024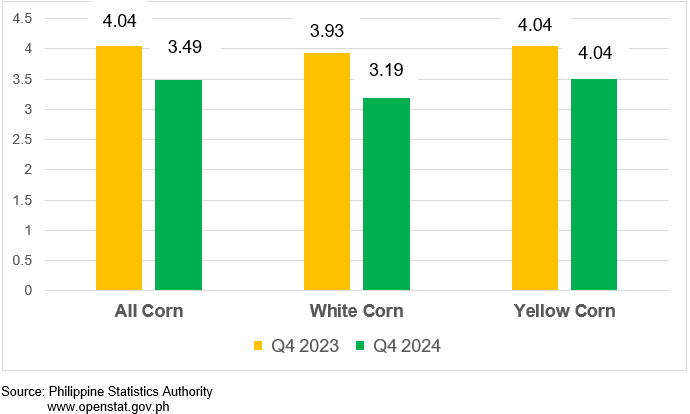
TECHNICAL NOTES
Corn Production Survey (CPS) is one of the major agricultural surveys conducted by the Philippine Statistics Authority (PSA). These generate estimates and forecasts on corn production, area and yield and other production-related data that serve as inputs for policy making and programs on corn
These are quarterly surveys which cover sample farming households in sample barangays in all provinces except Batanes. Data item gathered on this survey includes production, area planted/harvested and yield by seed type; usage of seeds, fertilizer and pesticides; source of irrigation water and adequacy, monthly distribution of production and area harvested; farm household disposition of production; area on standing crop for the quarter; and awareness and availment of palay program interventions.
Production- this refers to quantity produced and actual harvested during the reference period. It includes those harvested but damaged, stolen, given away, consumed, given as harvesters’ and threshers’ shares, reserved, etc. Palay/Corn production from seed growers which are intended for seed purposes is excluded from the survey.
Parcel- this refers to one contiguous piece of land under one form of tenure without regard to land use. Both the contiguity and one form of tenure conditions should be met for a piece of land to be classified as one parcel. Contiguous means that the piece of land is not separated by natural or man-made boundaries such as river, dike, and road that are not part of the holding.
A parcel may be surrounded by other lands, water, road, forest, or other features that are not part of the holding or part of the holding under different land tenure. A parcel may consist of one or more fields or plots adjacent to each other.
Area Harvested- actual area from which harvests area realized.
Yield- an indicator of productivity derived by dividing total production by the area harvested.
sgd.
RANDOLF M. LADERAS
(Supervising Statistical Specialist)
Officer-in-charge
| Attachment | Size |
|---|---|
|
|
623.98 KB |