

Release Date :
Reference Number :
SR 2019 - 15
Cordillera Administrative Region (CAR) Asset Accounts for Mineral Resources under the Environment and Natural Resource Accounting (ENRA) Project presents estimates on physical and monetary valuation of mineral resources covering the period 2004 to 2016. The UN System of Environmental-Economic Accounting (SEEA) 2012 – Central Framework is used in the accounting of mineral resources.
Gold reserves in metal content reaches 1.3 million kg in 2016
- The closing stock of gold reserve in metal content generally increased from 618.6 thousand kg in 2004 to 1.3 million kg in 2016. This represented an annual average growth of 17.5 percent or an average annual increase of 59.4 thousand kg. The highest stock of reserve was posted in 2012 with 2.2 million kg while the lowest was posted in 2009 at 564.8 thousand kg.
Table 1. Extraction, Closing Stock and Mine Life of Class A Gold Reserve in
Ore Form and Metal Content, CAR: 2004-2016
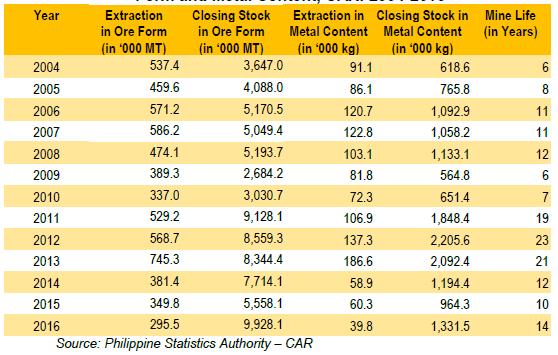
- In 2016, the ore extraction of 296 thousand metric ton had metal content of about 40 metric tons. The level of extraction in metal content declined by 4.3 thousand kg annually from 91.1 thousand kg in 2004 to 39.8 thousand kg in 2016. The extraction with the highest estimated metal content was recorded in 2013 with 186.6 thousand kg, while the lowest was recorded in 2016 with 39.8 thousand kg of gold.
-
The longest estimated mine life was determined in 2012 which can last up to 23 years, while the shortest was determined in years 2004 and 2009 with 6 years of mine life. It was also estimated that it would take 12 years on the average for the gold reserve to be exhausted or totally depleted.
Value of gold reserves in metal content is PHP14.3 billion in 2016
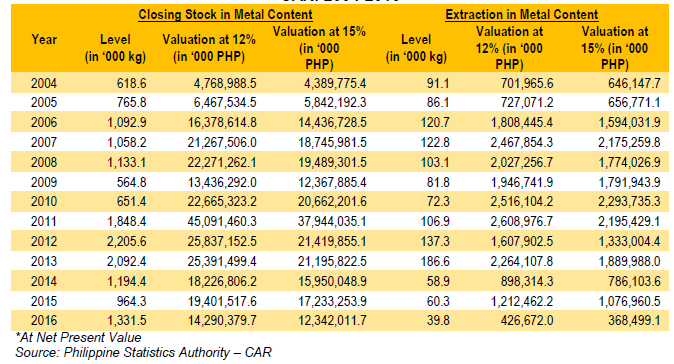
- At 12 percent discount rate, gold reserve in metal content yielded the highest value in 2011 at PHP45.1 billion. The value of stock increased by an annual average of 21.6 percent or PHP793.4 million yearly increment from PHP4.8 billion in 2004 to PHP14.3 billion in 2016.
- At 15 percent discount rate, the value of gold reserves increased by an annual average of 19.9 percent or PHP662.7 million annual increase. The highest derived monetary estimate was recorded at PHP37.9 billion in 2011. The lowest registered value of gold in metal content was recorded in 2004 at PHP4.4 billion.
Table 2. Monetary Valuation* of Closing Stock, Class A Gold Reserve, Extraction, CAR: 2004-2016
Additions to stock peaks in 2011 with 1.3 million kg
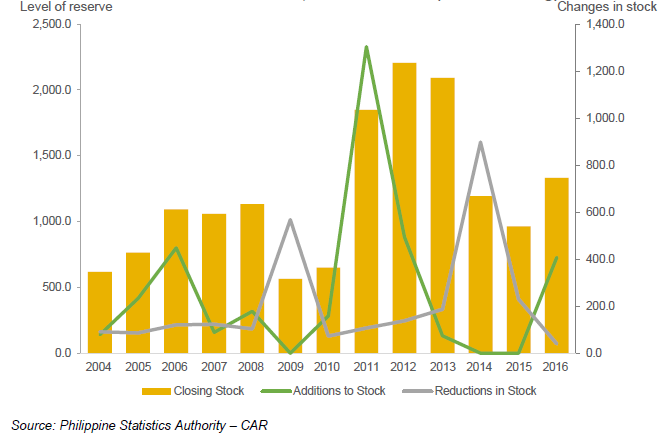
- The highest additions to stock was posted in 2011 with 1.3 million kg of gold metal content. All additions to stocks accounted 3.5 million kg. There were no recorded additions for years 2009, 2014 and 2015.
- From 2004-2016, reductions to stock accounted 2.8 million kg. The largest decrease was recorded in 2014 with a total of 898.0 thousand kg of metal content deducted from the stock. A large quantity of metal content equal to 568.3 thousand kg was also deducted in 2009.
Figure 1. Closing Stock and Changes in Stock of Class A, Gold Reserve in Metal Content, CAR: 2004-2016 (in thousand kg)
Class B gold metal content increases while Class C decreases
- Class B gold metal content displayed an overall upward trend. The highest level of gold metal content was recorded in 2010 with 445.6 kg while the lowest was recorded in 2009 with 38.2 thousand kg
Table 3. Summary Closing Stock of Class B and C Gold Reserve in Metal Content, CAR: 2004-2016 (in thousand kg)
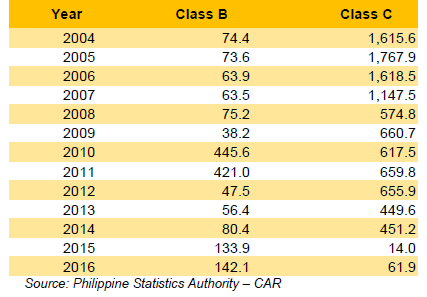
- Class C on the other hand exhibited a downward trend with 12.5 percent annual average decline from 2004 to 2016. The largest reserve in metal content was estimated in 2005 with 1.6 million kg. The stock of reserve decreased by 96.9 percent in 2015 from 451.2 thousand kg in 2014.
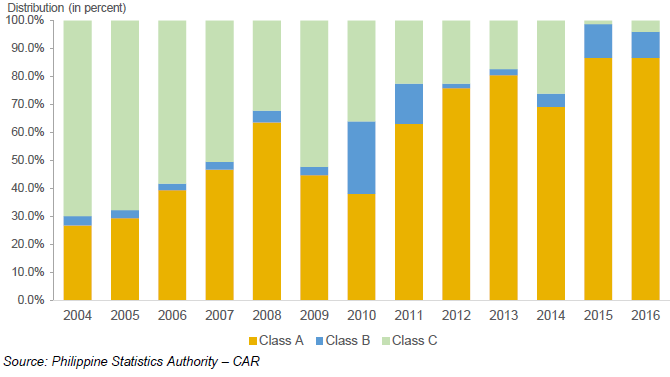
Class A shares the highest to total stock of gold metal content in 2016
- As shown in Figure 2, Class A shared the highest to the total stock with as much as 86.7 percent in 2016 or equivalent to 1.3 million kg. On the average, Class A contributed 1.2 million kg of gold in metal content during the period covered.
- Class C came second with 35.5 percent average contribution or 791 thousand kg during the period.
- Class B shared the least with an average contribution of 6.8 percent or 132.0 thousand kg of gold metal content.
Figure 2. Share of Class A, B and C Gold Reserve to the Total Stock, in Metal Content, CAR: 2004-2016 (in thousand kg)
TECHNICAL NOTES
Class A gold ore refers to commercially recoverable gold ore reserves/resources.
Class B gold ore refers to potentially commercially recoverable gold ore reserves/resources.
Class C gold ore refers to non-commercial and other known gold deposits.
Extraction is the quantity of the resource physically removed from the deposit.
Reappraisals relate to either additions or reductions in the estimated available stock of a specific deposit or to changes in the categorization of specific deposits between class A, B or C based on changes in geologic information, technology, resource price or a combination of these factors.
System of Environmental-Economic Accounting (SEEA) 2012 – Central Framework is an international statistical standard for environmental-economic accounting. It is a multipurpose conceptual framework for understanding the interaction between the economy and the environment.
| Attachment | Size |
|---|---|
|
|
321.97 KB |