Cordillera Administrative Region (CAR) Asset Accounts for Mineral Resources under the Environment and Natural Resource Accounting (ENRA) Project present estimates on physical and monetary valuation of mineral resources covering the period 2004 to 2016. The UN System of Environmental-Economic Accounting (SEEA) 2012 – Central Framework was used in the accounting of mineral resources.
- Extraction of copper ore increased by an annual average growth of 2.2 percent or 41,232.1 metric ton (MT) of ore yearly within the 13-year accounting period. Extraction peaked in 2014 with 9.5 million MT of copper extracted. The lowest level of extraction was in 2012 at 5.6 million MT. About 112.8 million MT of copper ore were.
Table 1. Extraction and Closing Stock of Class A Copper Reserve, Ore Form,
CAR: 2004-2016
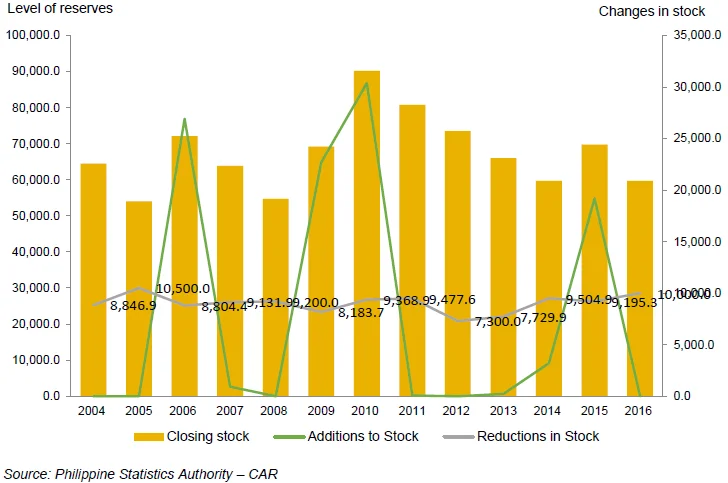
- From year 2004 to 2016, the closing stock of Class A copper ore reserve declined by an annual average of 1.0 percent or 400 thousand MT yearly from 64.5 million MT in 2004 to 59.7 million MT in 2016. The highest closing stock reported during the period covered was recorded in 2010 with 90.2 million MT while the lowest was in 2005 at 54.0 million MT with an average closing stock of 67.5 million MT.
Additions to stock peaked in 2010 with 30.4 million MT
- Figure 1 shows the level of closing stocks and changes in the stock of copper ore reserves. In 2010, the highest additions to stock was recorded where 30.4 million MT was added. On the other hand, the lowest addition to stock incurred in 2011 at 77,575.0 MT. There were no recorded additions for the years 2004, 2005, 2008, 2012 and 2016.
- All additions to stocks from 2004 to 2016 amounted to 103.6 million MT of ore with an annual average increase of 8.0 million MT. These additions to stock of copper ore reserves were mainly contributed by the upward reappraisals.
Figure 1. Closing Stock and Changes in Stock of Class A,
Copper Reserve, Ore Form, CAR: 2004-2016 (in thousand MT)

- In the span of 13 years, the total reductions in stock of copper ore reserves accumulated to 117.2 million MT with an average reduction of 9.0 million MT yearly. The biggest of which was recorded in 2005 with a total of 10.5 million MT of copper ore deducted and the smallest incurred reduction was observed in 2012 at 7.3 million MT. The main contributor of reduction in stock is the extraction of copper ore.
Stock of Classes B and C remains constant
- Within the span of 13 years, the stock of classes B and C copper ore was left untouched at 63.0 million MT and 123.0 million MT, respectively without any increase or decrease (See Table 2).
Table 2. Summary Closing Stock of Class B and C Copper Reserve,
Ore Form, CAR: 2004-2016 (in thousand MT)
Class C has the largest share to the total copper ore reserve
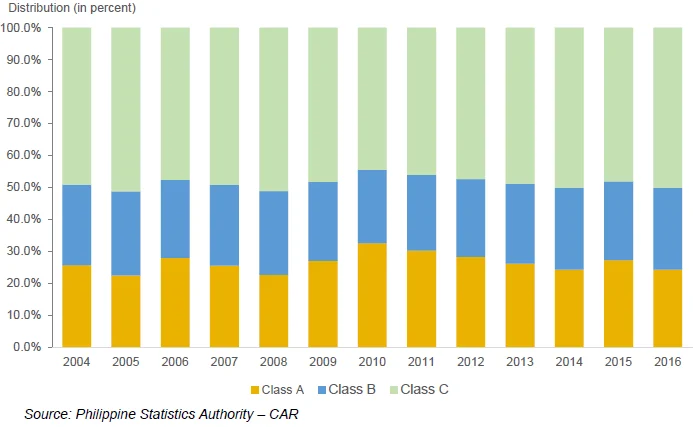
- Figure 2 shows the shares of Classes A, B and C to the total gold ore reserve from 2004 to 2016. Class C posted the largest share in the volume of stock of copper ore with an average share of 69 percent. Note that copper ore reserve for both Class C and Class B remained the same during the period covered.
- Class A came second with an average share of 16 percent or an average volume of 67.5 million MT from 2004 to 2016. Class B posted the least with an average share of 15 percent or 63.0 million MT.
Figure 2. Share of Class A, B and C Copper Reserve to the Total Stock,
Ore Form, CAR: 2004-2016 (in thousand MT)


