

Release Date :
Reference Number :
SSR 2023-50
The Provincial Product Accounts or the PPA aims to present a comprehensive picture of the sub-regional economies by providing a more appropriate measure and assessment of a province’s and highly urbanized city’s economic performance through the measure of Gross Domestic Product or GDP.
PPA will serve as an important tool in strengthening the planning and decision-making of sub-regional policymakers and other stakeholders in crafting more informed economic policies.
In 2021, the Philippine Statistics Authority addressed the clamor for more granular economic statistics through the PPA. In 2022, the Cordillera Administrative Region was selected to be one of the six additional pilot regions to compile the PPA annually. To date, the compilation of PPA has been completed for the sixteen regions or a total of 81 provinces and 17 HUCs, covering the period 2018 to 2022.
By 2025, the PPA will be institutionalized in all provinces and HUCs in the Philippines.

- The economy of the City of Baguio grew further by 11.3 percent in 2022 from a 10.0 percent economic upturn in 2021.
- The economic structure of the City of Pines was predominantly Services-based, with Manufacturing as the highlighted industry which yielded a share of 21.3% to the total regional economy.
- City of Baguio ranked first among the economies in Cordillera in overall GDP and recorded a per capita GDP that was higher than the region.
Figure 1. Baguio City GDP: 2019-2022
(at Constant 2018 Prices, Levels in Billion Pesos, Growth Rates in Percent)
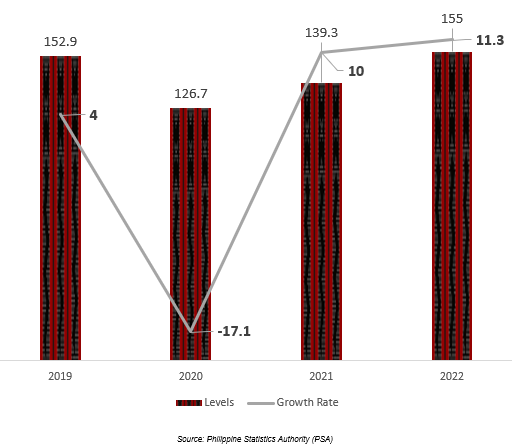
Baguio City’s economy grows by 11.3% in 2022
The total economic output of Baguio City increased from the PhP 139.3 billion GDP in 2021 to PhP 155.0 billion in 2022. This was an increase in the gross value added of the production of goods and services, amounting to PhP 15.7 billion.
The economy of the City of Baguio bounced back from a -17.1 percent decline in 2020 and recorded a growth of 11.3 percent in 2022.
Looking at the time series data, it can be observed that the GDP of the City of Baguio recovered in 2021 and further expanded in 2022, indicating its economic recovery from the effects of the pandemic. The city’s 2022 GDP of PhP 155.0 billion exceeded the pre-pandemic level of PhP 152.8 billion in 2019.
Figure 2. Growth Rates of the 16 Highlighted Industries
City of Baguio: 2021 to 2022
(at Constant 2018 Prices, in Percent)

Transportation and storage grow the fastest at 63.6 percent
All 16 industries grew in 2022, with Transportation and storage recording the fastest growth at 63.6 percent. However, it is notable that this industry comprises 2.2 percent of the total GDP of the City of Baguio.
The industry with the second fastest growth was Accommodation and food service activities, with 50.6 percent. This industry accounted for 7.8 percent of the city's total economy.
This was followed by Other services, encompassing various activities such as live performances, operation of museum sites, sports, gambling, recreation activities, personal grooming, beauty parlor/salon services, laundry, and funeral-related activities. Other services recorded a growth of 47.1 percent.
It is notable that these three industries are tourism-related. The easing of travel restrictions and the opening of borders are believed to have significantly influenced their accelerations.
Figure 3. Baguio City’s GDP Percent Distribution by Industry: 2022
(at Constant 2018 Prices, in Percent)
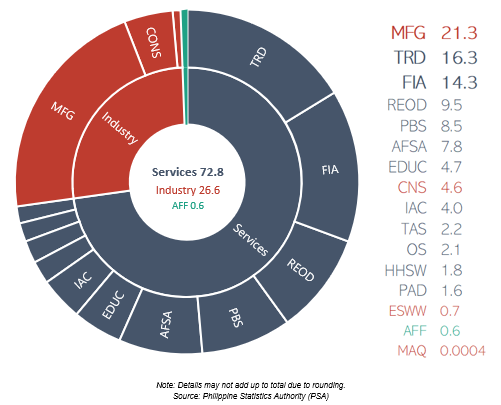
Services comprise 72.8% of Baguio City’s economy
In terms of contribution of major industries to the city’s economy, Services accounted for more than half of the city’s total economic output with a 72.8 percent share. This was followed by Industry with a share of 26.6 percent, and AFF with only 0.6 percent.
As to the distribution of the highlighted industries, Manufacturing was the highest contributor to the city’s economy with 21.3 percent. The manufacturing of semi-conductor devices and other electric components, together with the manufacturing of other air and spacecraft and related machineries propelled the manufacturing sector of Baguio City.
Wholesale and retail trade, repair of motorcycles and motor vehicles had the second largest share, with 16.3 percent. This was brought about by the robust activity in retail trade. Financial and insurance activities followed with 14.3 percent share.
On the other hand, the industry with the least proportion to city’s economic output was Mining and quarrying with only 0.0004 percent share.
Figure 4. Share of Provinces and HUC to the GRDP of CAR: 2022
(at Constant 2018 Prices, in Percent)
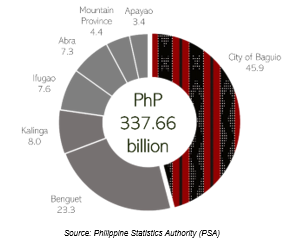
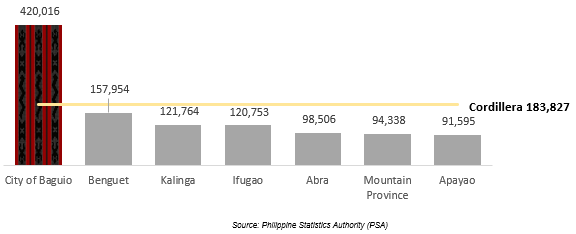
Figure 5. Per Capita GDP of the Economies in Cordillera: 2022
(at Constant 2018 Prices, in Philippine Peso)
Baguio ranks 1st in overall GDP
The City of Baguio had the largest share to the economy of the Cordillera with 45.9 percent which can be translated to an economic output of PhP 155.0 billion.
The City of Baguio had the highest per capita GDP among the sub-regional economies of the Cordillera and was the only economy that surpassed the region’s per capita GDP. Notably, Baguio City also had the highest per capita GDP among all highly urbanized cities included in the compilation Provincial Product Accounts for 2022.
(SGD)
VILLAFE P. ALIBUYOG
Regional Director
_________________________
TECHNICAL NOTES
Gross Domestic Product (GDP)
- The aggregate of gross value added (GVA) of all resident producer units in a province/city.
- Measures the economic performance of the province/city from the perspective of the producers of goods and services. It covers the value of goods and services produced in the region during the reference period.
- GDP measures the relative contribution of the 16 highlighted industries under the Philippine Standard Industrial Classification (PSIC), namely:
- Agriculture, Forestry, and Fishing (AFF)
- Mining and Quarrying (MAQ)
- Manufacturing (MFG)
- Electricity, Steam, Water and Waste Management (ESWW)
- Construction (CNS)
- Wholesale and retail trade; repair of motor vehicles and motorcycles (TRD)
- Transportation and storage (TAS)
- Accommodation and food service activities (AFSA)
- Information and communication (IAC)
- Financial and insurance activities (FIA)
- Real estate and ownership dwellings (REOD)
- Professional, and business services (PBS)
- Public administration and defense; compulsory social activities (PAD)
- Education (EDUC)
- Human health and social work activities (HHSW)
- Other services (OS)
Constant prices
- way of measuring the real change in output. A year is chosen as the base year. For any subsequent year, the output is measured using the price level of the base year. This excludes any nominal change in production and enables a comparison of the actual goods and services produced.
Growth Rate
- refers to the percentage change of a specific variable within a particular time.
Percent Distribution
- means the percentage obtained by dividing the aggregate value of the Share Consideration (determined by reference to the Closing Share Price) by the Aggregate Consideration Value.
Per Capita GDP
- a financial metric of the economic output per person and is calculated by dividing the GDP by its population.
| Attachment | Size |
|---|---|
|
|
549.11 KB |