

Release Date :
Reference Number :
SSR 2023-21
The Philippine Statistics Authority (PSA) releases the country’s official poverty statistics for the basic sectors. PSA provides the estimates of poverty incidences for 10 of the 14 basic sectors identified in Republic Act 8425 or the Social Reform and Poverty Alleviation Act using the income and sectoral data from the merged Family Income and Expenditure Survey (FIES) and Labor Force Survey (LFS).
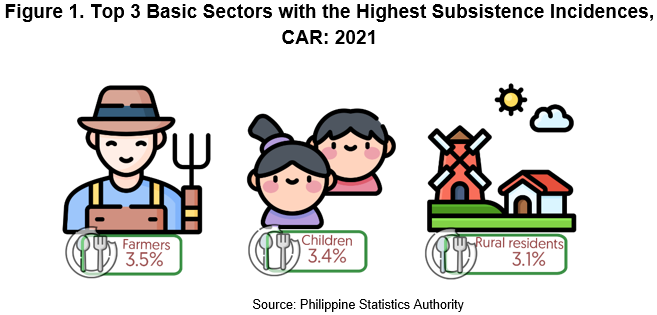
Farmers post highest subsistence incidence in CAR in 2021
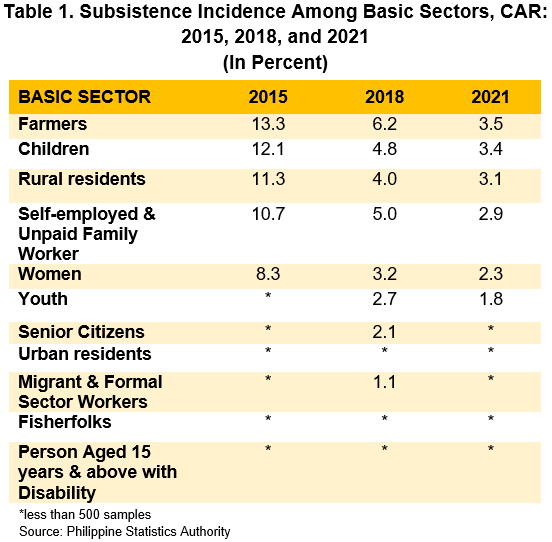
Farmers had the highest subsistence incidence in CAR with 3.5 percent in 2021. This was followed by Children with 3.4 percent, and Rural residents with 3.1 percent. This means that these sectors had the highest proportion of individuals belonging to families with income below the official food thresholds compared to the other basic sectors of the population.
Self-employed and unpaid family workers, Women, and Youth had subsistence incidences of 2.9 percent, 2.3 percent, and 1.8 percent, respectively.
Meanwhile, Senior citizens, Urban residents, Migrant and formal sector workers, Fisherfolks, and Persons aged 15 years and above with disability had less than 500 food poor individuals in the region in 2021.
Subsistence incidence improves in all basic sectors
In addition to the 9 basic sectors previously published, poverty estimates were also generated for other two sectors, namely: (1) individuals residing in rural areas, and (2) self-employed and unpaid family workers. These were used as proxy indicators for workers in the informal sector.
All the basic sectors in the region exhibited a significant decrease in subsistence incidences from 2015 to 2021. Farmers and Children were consistently the top basic sectors with the highest subsistence incidence.
Farmers had the largest reduction with 2.7 percentage points in its 2018 subsistence incidence, and 9.8 percentage points from 2015 subsistence incidence. Children also had an improvement on subsistence incidence by 1.4 percentage points reduction.
Rural residents have highest number of food poor
The top 3 basic sectors with the highest estimated number of food poor population were Rural residents, Children, and Women.
Individuals residing in rural areas (belonging to food poor families) were estimated to be 34.3 thousand, the highest among the basic sectors in the region in 2021. But the number was a reduction of 32.1 percent from the 2018 count of 50.5 thousand food poor individuals, and reduction of 76.2 percent from the 2015 estimate of 144.4 thousand.
Children came second with an estimated 22.3 thousand food poor individuals. Children refer to individuals below 18 years old based on, RA 7610, Special Protection of Children Against Abuse, Exploitation and Discrimination Act. In 2018, the number was 30.9 thousand food poor children and in 2015 was 78.6 thousand food poor children.
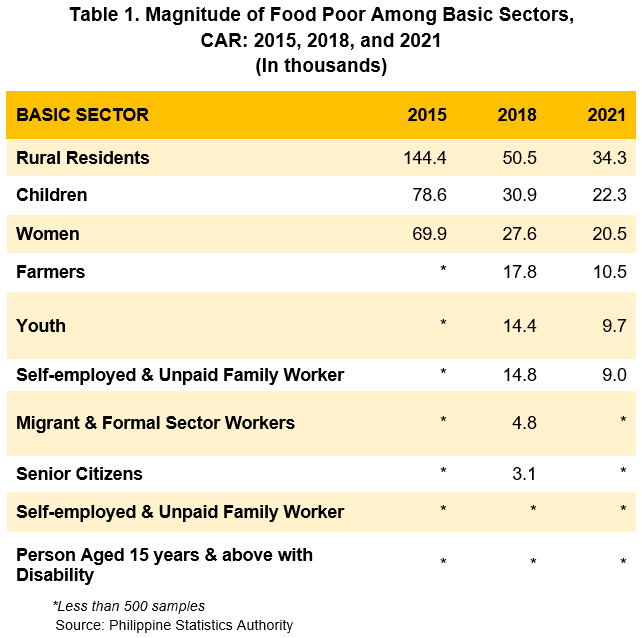
The third highest number of poor individuals in 2021 were women with an estimate of 20.5 thousand. The number of food poor women was estimated at 27.6 thousand in 2018 and 69.9 thousand in 2018.
(SGD)
VILLAFE P. ALIBUYOG
Regional Director
__________________________________________________
TECHNICAL NOTES
Poor refers to individuals and families whose income fall below the poverty threshold as defined by the National Economic and Development Authority (NEDA) and/or cannot afford in a sustained manner to provide their minimum basic needs of food, health, education, housing, and other essential amenities of life.
Food Threshold refers to the minimum income required for a family/ individual to meet the basic food needs, which satisfies the nutritional requirements for economically necessary and socially desirable physical activities. Also referred to as the subsistence threshold or the food poverty line.
Subsistence Incidence refers to the proportion of families/individuals with per capita income/expenditure less than the per capita food threshold to the total number of families/ individuals.
Basic Sectors as defined in RA 8425 as the disadvantaged or marginalized sectors of the Philippine society, namely:
|
1. Farmer-peasant; 2. Artisanal fisherfolk; 3. Workers in the formal sector and migrant workers; 4. Workers in the informal sector; 5. Indigenous peoples and cultural communities; 6. Women; 7. Differently-abled persons; |
8. Senior citizens; 9. Victims of calamities and disasters; 10. Youth and students; 11. Children; 12. Urban poor; 13. Cooperatives; and 14. Non-government organization.
|
Child refers to individual below 18 years old based on, RA 7610, Special Protection of Children Against Abuse, Exploitation and Discrimination Act.
Youth refers to individuals aged 15 to 30 years old, based on RA 8044, The Youth in Nation-Building Act.
Senior citizen refers to an individual aged 60 years old and above, based on RA 9257, the Expanded Senior Citizens Act.
Migrant and formal sector workers refer to individuals who are Overseas Contract Workers (OCW) or Workers other than OCWs or employed persons working for private establishments and government organizations and corporations.
Farmers refer to employed individuals 15 years old and over whose primary occupation is farming, plant growing or animal production. These include occupations under Skilled Agricultural, Forestry and Fishery Works and Elementary.
Self-employed and unpaid family workers refer to employed individuals 15 years old and over who are either self-employed or worked without pay on family-owned farm or business. This is a proxy indicator for the informal sector workers.
Functional difficulty is classified into six core difficulties. The concepts and definitions are based on the International Classification of Functioning, Disability and Health (ICF) of the World Health Organization (WHO). These difficulties include the following: a) Difficulty seeing even if wearing eye glasses; b) Difficulty hearing even if using hearing aid; c) Difficulty walking or climbing steps; d) Difficulty remembering or concentrating; e) Difficulty with self-care; and f) Difficulty communicating.
| Attachment | Size |
|---|---|
|
|
292.91 KB |