Inflation Rates in the Philippines: 2017 and 2018
- The national average inflation rate for 2018 was 5.2 percent. This was 2 percentage points higher than the national average inflation of 3.2 percent for 2017.
- Inflation rate in the Philippines ascended from 3.4 percent in January 2018 and peaked in September and October with 6.7 percent. Year 2018 ended with an inflation rate of 5.1 percent.
- In 2017, the national inflation rate started with 2.7 percent and ended with 3.3 percent. Inflation did not breach the 3.5 percent ceiling during the period.
Figure 1. Monthly Inflation Rates, Philippines:
2017 and 2018 (2012=100)

Inflation Rates in CAR: 2017 and 2018
- The average regional inflation rate for 2018 was 3.8 percent, below the national average of 5.2 percent. In 2017, the regional average inflation was 1.9 percent, also lower than the national average of 3.2 percent.
-
Inflation rate in the Cordilleras ascended from 2.3 percent in January 2018 and peaked in October with 5.2 percent. Year 2018 ended with an inflation rate of 3.4 percent.
-
In 2017, the CAR inflation rate started with 1.9 percent in January and ended with 1.7 percent in December. Regional inflation recorded the lowest in July and November with 1.4 percent and the highest with 2.4 percent in February and March.
Figure 2. Monthly Inflation Rates, CAR:
2017 and 2018 (2012=100)
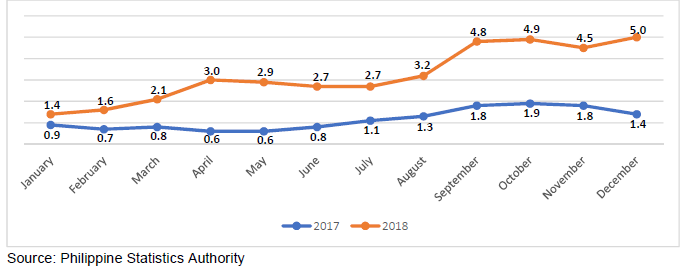
Inflation Rates in the Province of Abra: 2017 and 2018
- The average inflation rate for 2018 for the province of Abra was 3.2 percent, 2 percentage points higher than the provincial average of 1.2 percent in 2017. The average inflation rates were lower than the regional average for both years.
- Inflation rate in Abra ascended from 1.4 percent in January and peaked in December at 5.0 percent in the year 2018.
- In 2017, inflation rate in the province started with 0.9 percent in January and ended with 1.4 percent in December. Provincial inflation recorded the lowest in May and April with 0.6 percent and the highest with 1.9 percent in October.
Figure 3. Monthly Inflation Rates by Province, ABRA:
2017 and 2018 (2012=100)
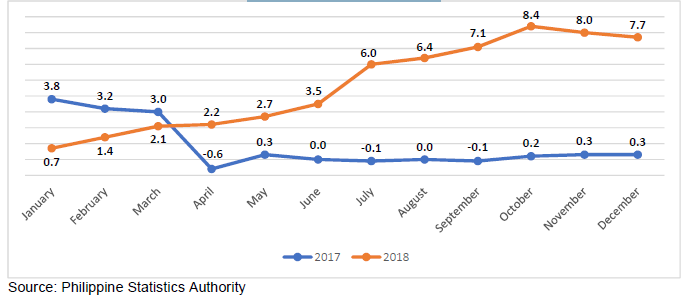
Inflation Rates in the Province of Apayao: 2017 and 2018
- The average provincial inflation rate for 2018 was 4.7 percent. This was 3.9 percentage points higher than the provincial average of 0.8 percent in 2017.
- From 0.7 percent inflation rate in January 2018 ascended and peaked in October with 8.4 percent. The year ended with an inflation rate of 7.7 percent.
- Inflation rate in 2017 descended from 3.8 percent in January and went to its lowest in April with -0.6 percent and ended with 0.3 percent in December.
Figure 4. Monthly Inflation Rates by Province, Apayao:
2017 and 2018 (2012=100)
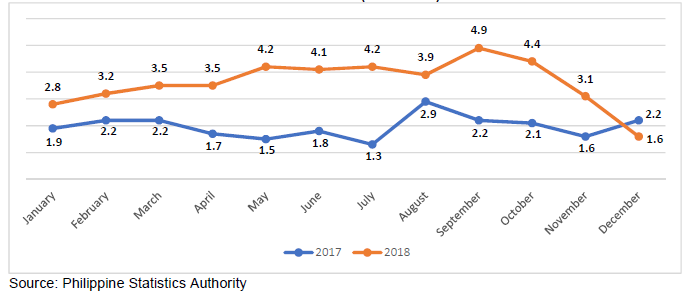
Inflation Rates in the Province of Benguet: 2017 and 2018
- The average provincial inflation rate went up in 2018 with 3.6 percent from the average of 2.0 percent in 2017.
- In 2018, the highest recorded increase in prices in Benguet was in September with 4.9 percent. The price increase was lowest in December with 1.6 percent.
- Benguet’s inflation rate started with 1.9 percent in January 2017 and ended with 2.2 percent in December 2017. Lowest inflation rate was recorded in July with 1.3 percent and the highest was recorded in August with 2.9 percent.
Figure 5. Monthly Inflation Rates by Province, Benguet:
2017 and 2018 (2012=100)
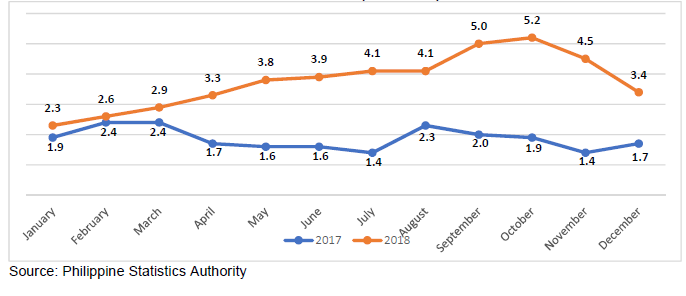
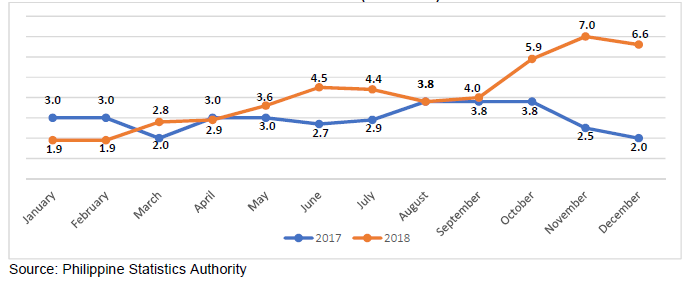
Inflation Rates in the Province of Ifugao: 2017 and 2018
- Average inflation rate in the province of Ifugao for 2018 was 4.1, above the regional average of 3.8 percent. In 2017, the provincial average inflation was 2.9 percent, also higher than the regional average of 1.8 percent.
- In 2018, inflation rate ascended from 1.9 percent in January to 6.6 percent in December. Highest inflation rate was recorded in November with 7.0 percent and the lowest was recorded in January and February with 1.9 percent.
- Inflation rate in 2017 started with 3.0 percent in January and ended with 2.0 percent in December. It was highest in September and October with 3.8 percent and it was lowest in March and December with 2.0 percent.
Figure 6. Monthly Inflation Rates by Province, Ifugao:
2017 and 2018 (2012=100)
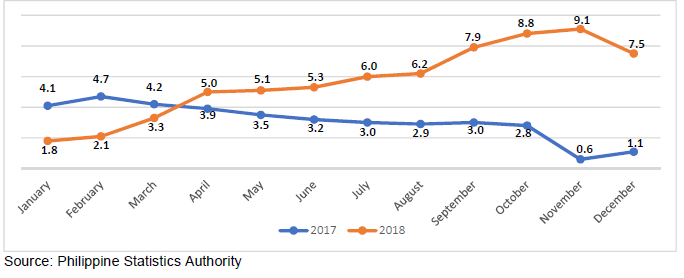
Inflation Rates in the Province of Kalinga: 2017 and 2018
- In 2018, the average provincial inflation rate was 5.7 percent, the highest among the Cordillera provinces. There was an increase of 2.6 percentage points compared to the provincial average inflation of 3.1 percent in 2017, also the highest average inflation during the period.
-
Inflation rate in the province ascended from 1.8 percent in January 2018 and peaked in November 2018 with 9.1 percent. Year 2018 ended with an inflation rate of 7.5 percent.
-
In 2017, the inflation rate of Kalinga started with 4.1 percent in January and ended with 1.1 percent in December. Provincial inflation rate recorded lowest in November with 0.6 percent and the highest with 4.7 percent in February.
Figure 7. Monthly Inflation Rates by Province, Kalinga:
2017 and 2018 (2012=100)
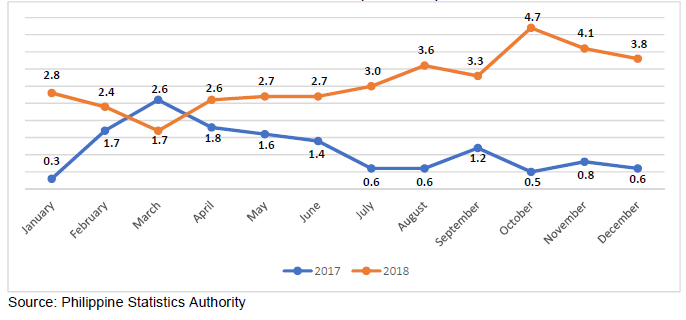
Inflation Rates in the Province of Mt. Province: 2017 and 2018
- The average provincial rate for 2018 was 3.0 percent, lower than the regional average of 3.8 percent. In 2017, the provincial average inflation was 1.2 percent, also lower that the regional average of 1.8 percent.
-
Inflation rate in the province for 2018 went up from 2.8 percent in January and peaked in October with 4.7 percent. The year ended with an inflation rate of 3.8 percent.
-
In 2017, the provincial inflation rate started with 0.3 percent in January and ended with 0.6 percent in December. Provincial inflation recorded the highest in March with 2.6 percent and the lowest in October with 0.5 percent.
Figure 8. Monthly Inflation Rates by Province, Mt. Province:
2017 and 2018 (2012=100)