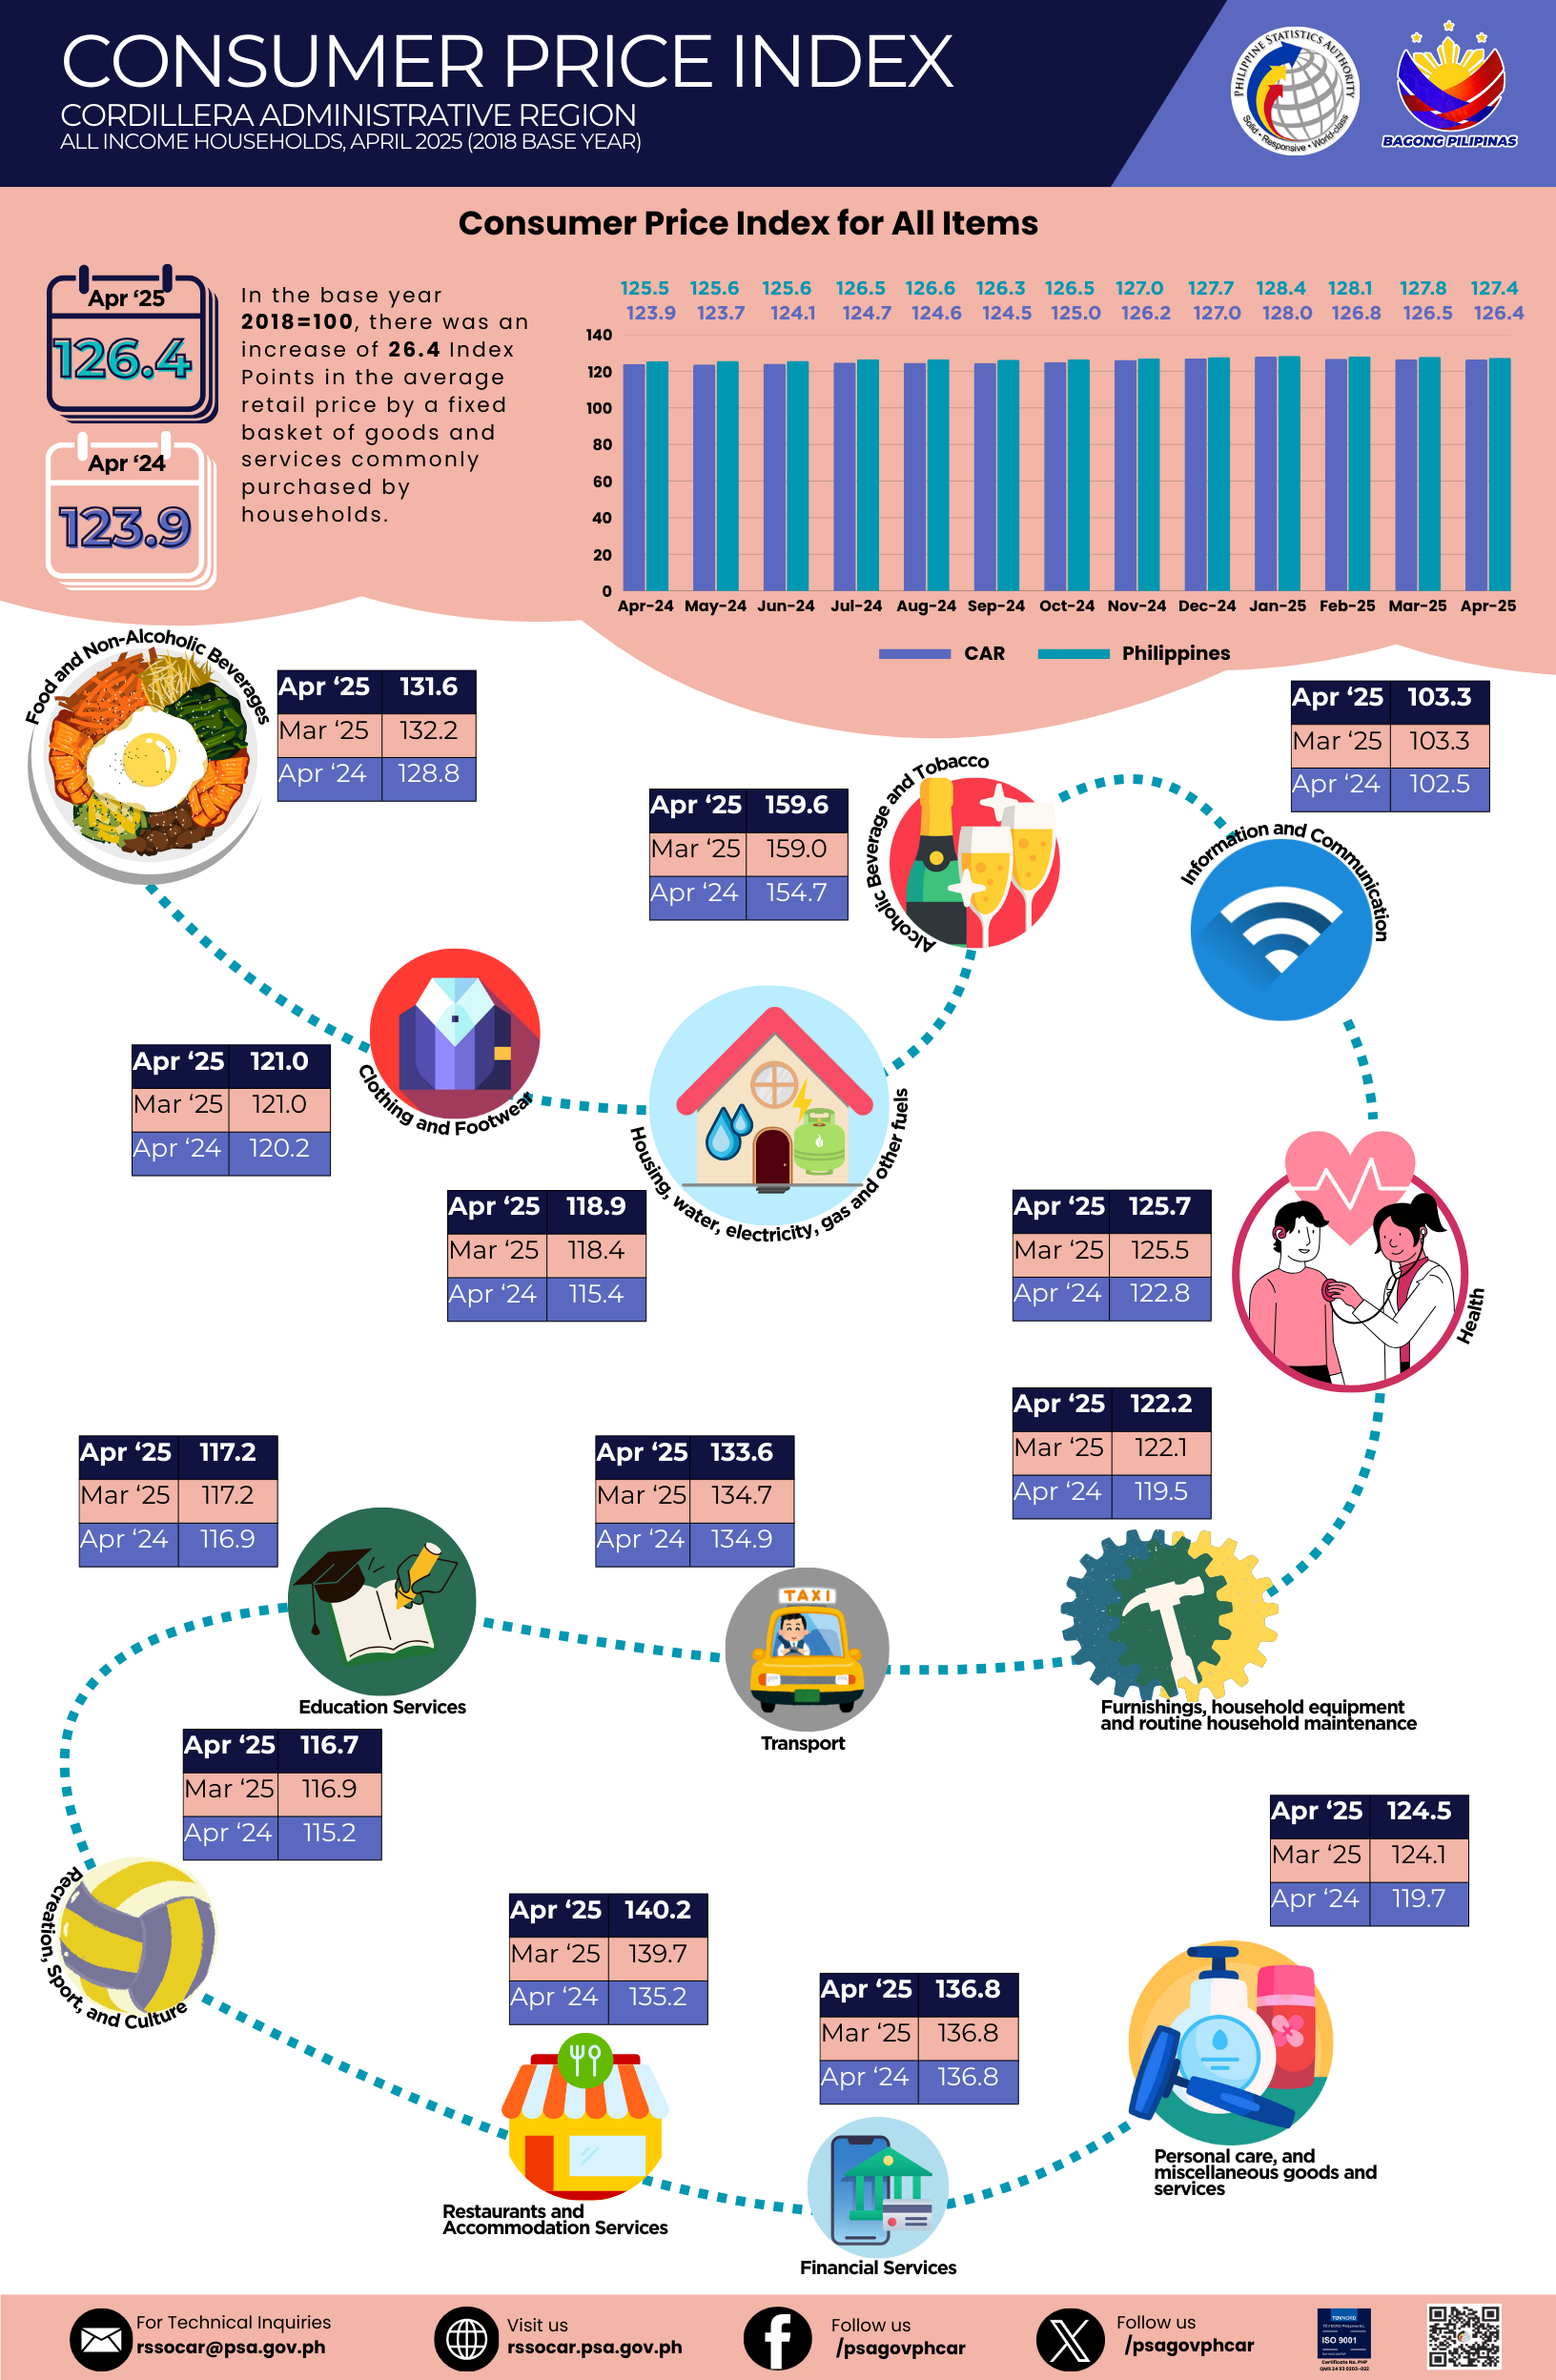
Consumer Price Index
- Consumer Price Index (CPI) is the general measure of the change in the average retail prices of a market basket or collection of goods and services commonly purchased by the average Filipino household.
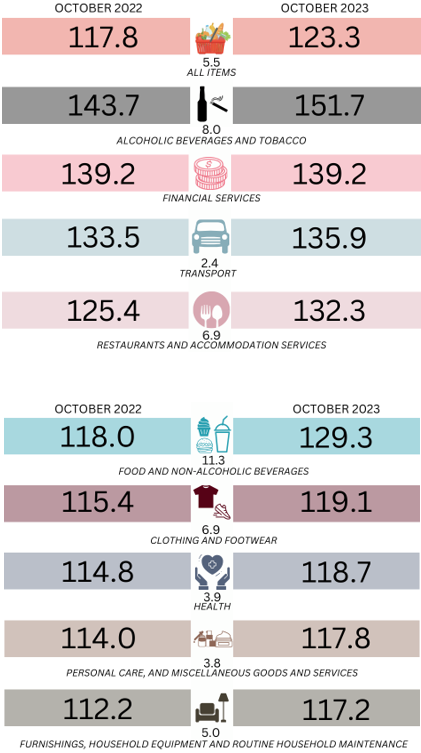
- The CPI of the Cordillera Administrative Region (CAR) in October 2023 was 123.3. This was higher by 5.5 index points from the 117.8 CPI of October 2022 using 2018 as the base year.
- In general, the CPI increased reflecting the rise in the average prices of goods and services in all the six provinces and one highly-urbanized city (HUC) of CAR.
Figure 1. Consumer Price Index by Province and HUC, CAR: October 2023 (2018=100)
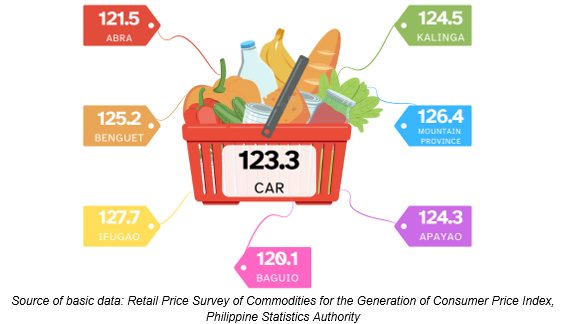
- Among the CAR provinces and HUC, Ifugao posted the highest CPI in October 2023 at 127.7 followed by Mountain Province at 126.4 and Benguet at 125.2. On the other hand, Baguio City recorded the lowest CPI at 120.1.
CPI by Commodity Groups
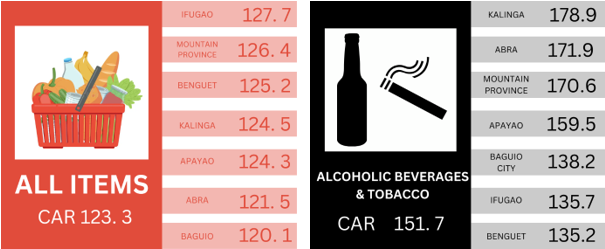
- Among the commodity groups, Alcoholic Beverages and Tobacco had the highest CPI in the region with 151.7 index points. Province-wise, Kalinga incurred the highest CPI on this commodity with 178.9 index points followed by Abra, Mountain Province, and Apayao with 171.9, 170.6, and 159.5 index points, respectively.
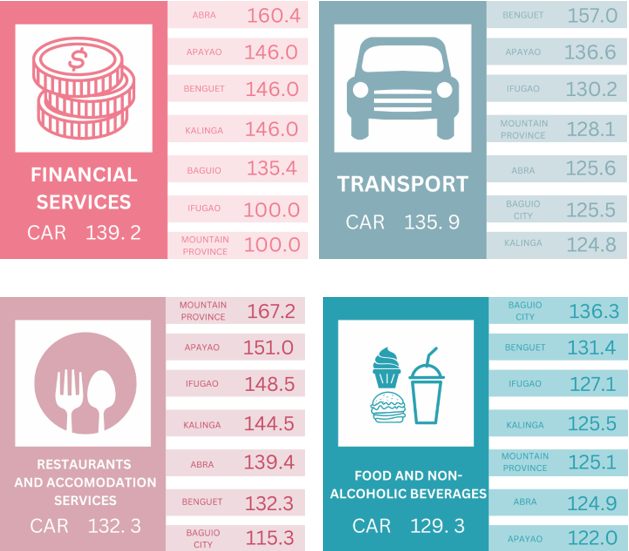
- Financial Services posted the second highest CPI in October 2023 among the commodity groups with 139.2 index points. Among the provinces, Abra had the highest index on Financial Services with 160.4 while Mountain Province and Ifugao had the lowest with 100.0 index points.
- Transport registered the third highest CPI with 135.9 index points. Benguet recorded the highest index on transport with 157 index points followed by Apayao and Ifugao with 136.6 and 130.2 index points, respectively.
- Information and Communication continued to incur the lowest CPI among the commodity groups in the region during the month of October 2023 with 102.3 index points. The province of Apayao posted the highest index on information and communication at 103.4 index points while Ifugao had the lowest with 99.9 index points.
Figure 2. Consumer Price Index by Commodity Group and by Province and
HUC, CAR: October 2023
(2018=100)
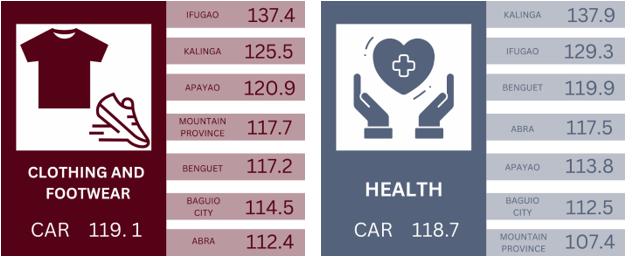
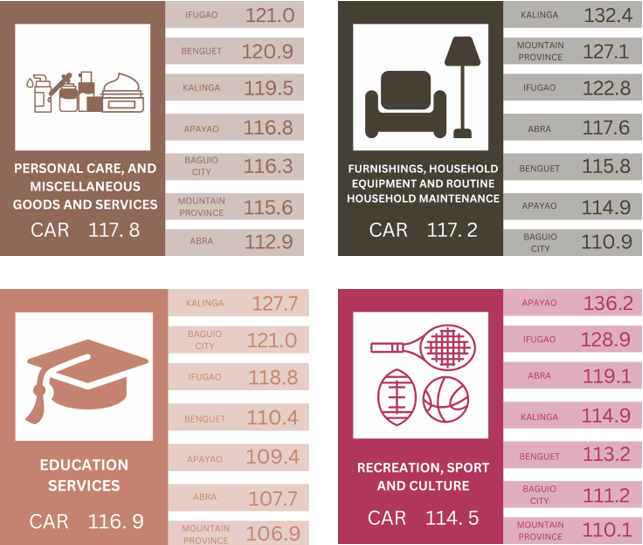
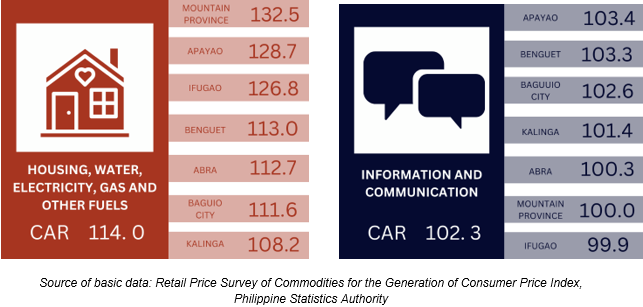
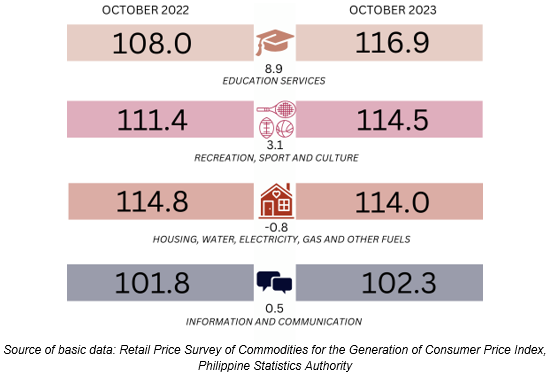
- By index point change, Food and Non-Alcoholic Beverages posted the highest increase (11.3 points). Increases were observed in all commodity groups with Financial Services logging the lowest increase.
Figure 3. Year-on-Year Consumer Price Index by Commodity Group, CAR:
October 2022 and 2023
(2018=100)
Inflation Rate
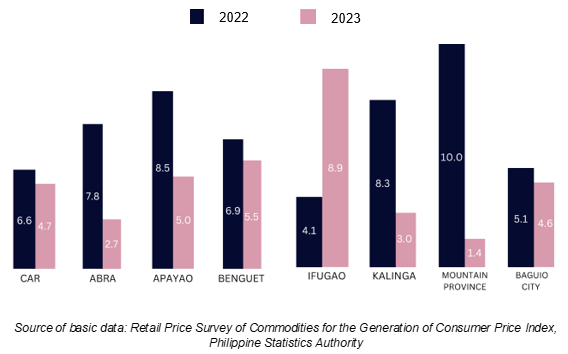
- The average increase in the prices of goods and services in the region was 4.7 percent in October 2023, lower by 1.9 percentage points compared to the 6.6 percent inflation in October 2022.
- Ifugao posted the highest inflation rate in October 2023 with 8.9 percent followed by Benguet with 5.5 percent. Conversely, the province of Mountain Province incurred the lowest inflation among all CAR provinces and HUC with 1.4 percent.
- The provinces of Abra, Apayao, Kalinga, and Mountain Province, as well as Baguio City recorded inflation rates that was lower than its October 2022 figure.
Figure 4. Year-on-year Inflation Rates by Province and HUC, CAR:
October 2022 and 2023
(2018=100)
By Commodity Group
- Alcoholic Beverages and Tobacco and Food and Non-Alcoholic Beverages recorded the highest inflation rate among all commodity groups in the region with 9.6 percent in October 2023 followed by Education Services and Restaurants and Accommodation Services with 8.2 and 5.5 percent, respectively.
- Among all commodities, the rate of Financial Services remained constant relative to the rate recorded in the previous month.
Figure 5. Inflation Rates by Commodity Groups, CAR: October 2023
(2018=100)

By Food Items, Year-on-Year
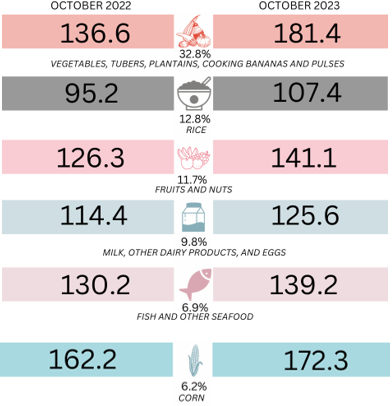
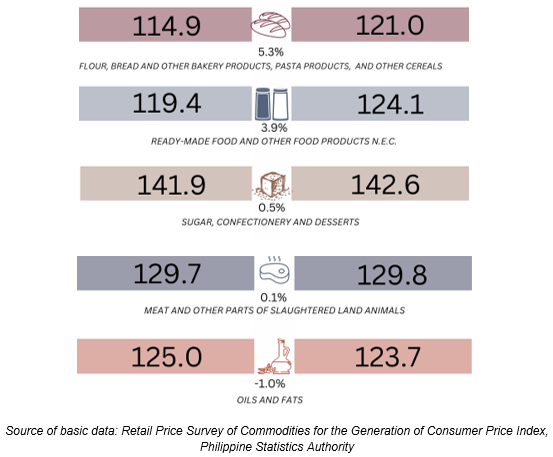
- Among the food items, Vegetables, Tubers, Plantains, Cooking Bananas and Pulses recorded the highest CPI in the region in October 2023 with 181.4 index points. This was followed by Corn, Sugar, Confectionery and Desserts Meat, Fruits and Nuts, and Fish and Other Seafood; and with 172.3, 142.6, 141.1, and 139.2 index points, respectively.
- In terms of inflation rate, Vegetables, Tubers, Plantains, Cooking Bananas and Pulses registered the highest rate with 32.8 percent followed by Rice with 12.8 percent, and Fruits and Nuts with 11.7 percent. On the other hand, Oils and Fats recorded the lowest rate in October 2023 at -0.1.
Figure 6. Year-on-Year CPI and Inflation Rate of Selected Food Items, CAR:
October 2022 and 2023
(2018=100)
Purchasing Power of the Peso
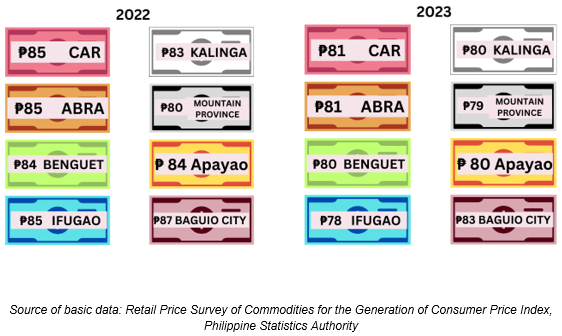
- The Purchasing Power of the Peso (PPP) in all the provinces and HUC of CAR weakened in October 2023 compared to the same month of the previous year.
- The value of 1 peso in the region was 81 centavos in October 2023. It dropped by four centavos from the 85-centavo worth of the peso in October 2022. Across provinces and HUC, Baguio City had the highest value at 83 centavos, higher than the regional value. This was followed by Abra at 81 centavos. Meanwhile, Ifugao had the lowest peso value at 78 centavos.
- In the same manner, a hundred pesos in 2018 was worth 85 pesos in October 2022.
Figure 7. Worth of a Hundred Pesos by Province and HUC, CAR: October 2023
(2018=₱100)
(SGD)
VILLAFE P. ALIBUYOG
Regional Director
_________________________
TECHNICAL NOTES
Consumer Price Index (CPI) is a general measure of the change in the average retail prices of a market basket or collection of goods and services commonly purchased by the average Filipino household.
Inflation Rate (IR) is the rate of change in the average price level between two periods (year-on year/month-on-month as measured by the CPI).
Purchasing Power of the Peso (PPP) measures how much the peso in the reference year is worth in another year.
Base Year (BY) is the reference point of the index number series, at which the index number is set to 100. It is the reference point of the index number series.
The CPI is now rebased to 2018 base year from the 2012 base year. The year 2018 was chosen as the next base year because it was the latest year when the Family Income and Expenditure Survey (FIES) results were made available.
The rebasing of the CPI is done periodically by the PSA due to the following: 1) to ensure that the CPI market basket continues to capture goods and services commonly purchased by households over time; 2) to update expenditure patterns of households; 3) to synchronize its base year with 2018 base year of the Gross Domestic Product and other indices produced by PSA such as the Producer Price Index (PPI) for Agriculture; PPI for Manufacturing; and Value of Production Index (VaPI), Volume of Production Index (VoPI), and Value of Net Sales Index (VaNSI) for Manufacturing.
Market Basket (MB) is a sample of goods and services commonly purchased by the households.


