

Building constructions increase by 16.1 percent in 2020
The total number of constructions from approved building permits issued by the Local Building Officials (LBOs) for the year 2020 accounted at 62 with an increase of 16.1 percent compared to the issued building permits from the previous year, as illustrated in Table 1.
Non-residential type of constructions recorded an increase of 29.4 percent from 36 in 2019 to 51 in 2020 while Residential type of constructions had decrease by 26.7 percent from 15 to 11 building construction projects. On the other hand, Addition to existing structures recorded nothing in 2020 as compared to one (1) in the previous year, Alteration and repair remained blank for both years.
Table 1. Summary of Construction Statistics from Approved Building Permits,
Ifugao: 2020 and 2019 (Details may not add up to total due to rounding)
| Type of Construction | 2020 | 2019 | Growth Rate |
|---|---|---|---|
| Total | |||
| Number | 62 | 52 | 16.1 |
| Floor Area (sq.m.) | 19,251 | 21,231 | (8.0) |
| Value (Php '000) | 107,528 | 172,459 | (37.6) |
| Residential | |||
| Number | 11 | 15 | (26.7) |
| Floor Area (sq.m.) | 2,804 | 2,457 | 12.4 |
| Value (Php '000) | 22,519 | 24,751 | (9.0) |
| Single house | |||
| Number | 11 | 14 | (21.4) |
| Floor Area (sq.m.) | 2,804 | 2,345 | 16.4 |
| Value (Php '000) | 22,519 | 22,243 | 1.2 |
| Duplex/Quadruplex | |||
| Number | 0 | 0 | 0 |
| Floor Area (sq.m.) | 0 | 0 | 0 |
| Value (Php '000) | 0 | 0 | 0 |
| Apartment/Accessoria | |||
| Number | 0 | 1 | 0 |
| Floor Area (sq.m.) | 0 | 112 | 0 |
| Value (Php '000) | 0 | 2,508 | 0 |
| Residential Condo | |||
| Number | 0 | 0 | 0 |
| Floor Area (sq.m.) | 0 | 0 | 0 |
| Value (PhP’000) | 0 | 0 | 0 |
| Other Residential | |||
| Number | 0 | 0 | 0 |
| Floor Area (sq.m.) | 0 | 0 | 0 |
| Value (PhP’000) | 0 | 0 | 0 |
| Non-residential | |||
| Number | 51 | 36 | 29.4 |
| Floor Area (sq.m.) | 16,717 | 18,734 | (10.8) |
| Value (PhP’000) | 85,009 | (147,098) | (42.2) |
| Commercial | |||
| Number | 19 | 27 | (29.6) |
| Floor Area (sq.m.) | 5,666 | 8,108 | (30.1) |
| Value (PhP’000) | 38,324 | 73,662 | (48.0) |
| Industrial | |||
| Number | 3 | 0 | 100 |
| Floor Area (sq.m.) | 936 | 0 | 100 |
| Value (PhP’000) | 4,996 | 0 | 100 |
| Institutional | |||
| Number | 6 | 6 | 0 |
| Floor Area (sq.m.) | 738 | 1,544 | (52.2) |
| Value (PhP’000) | 6,427 | 23,463 | (72.6) |
| Agricultural | |||
| Number | 22 | 3 | 86.4 |
| Floor Area (sq.m.) | 9,235 | 9,084 | 1.7 |
| Value (PhP’000) | 33,838 | 50,033 | (32.4) |
| Other Non-Residential | |||
| Number | 1 | 0 | 100 |
| Floor Area (sq.m.) | 142 | 0 | 100 |
| Value (PhP’000) | 1,424 | 0 | 100 |
| Addition | |||
| Number | 0 | 1 | (100) |
| Floor Area (sq.m.) | 0 | 40 | (100) |
| Value (PhP’000) | 0 | 610 | (100) |
| Alteration and Repair | |||
| Number | 0 | 0 | 0 |
| Floor Area (sq.m.) | 0 | 0 | 0 |
| Value (PhP’000) | 0 | 0 | 0 |
Non-residential building constructions increase by 29.4 percent
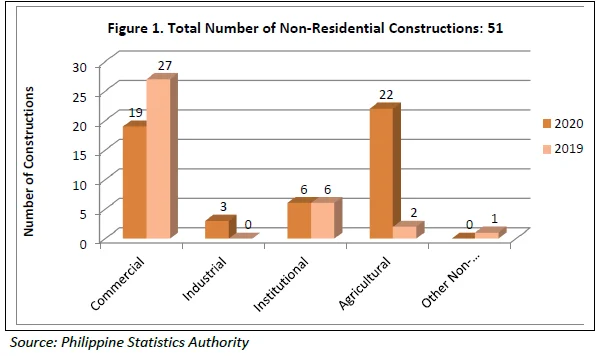
By type of constructions, non-residential building recorded the highest number of constructions in 2020 which totalled to 51 or 82.3 percent of the total number of constructions. This manifests an uptick of 29.4 percent increase from the previous year. Majority of non-residential constructions were Agricultural with 22 or 35.4 percent of the total, see Figure 1.
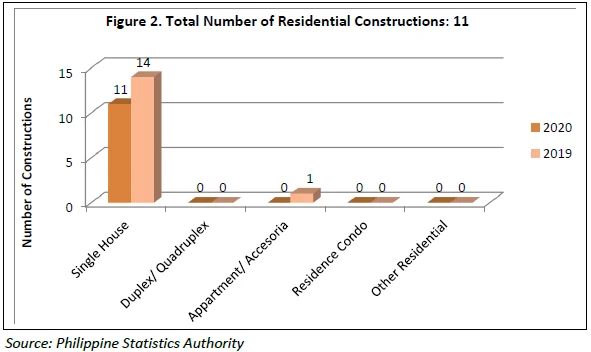
Meanwhile, residential accounted for the second highest count with 11 or 17.7 percent of the total number of constructions in 2020. This type of constructions dropped in number at an annual rate of 26.7 percent.
Addition to existing structures, which refers to any new construction that increases the height or area of an existing building, and Alteration and repair of existing structures, had no contribution, respectively, to the total number of constructions in 2020.
Among the type of non-residential buildings, Agricultural type of building constructions had the highest contribution of about 43.1 percent or 22 buildings constructed in 2020. It increased by 86.4 percent from 3 in 2019 to 22 in year 2020. Commercial type of constructions followed at about 37.2 percent or 19 approved building permits in 2020 which was decreased by 29.6 percent compared in 2019.
Total Value of Construction plunge to 37.6 percent
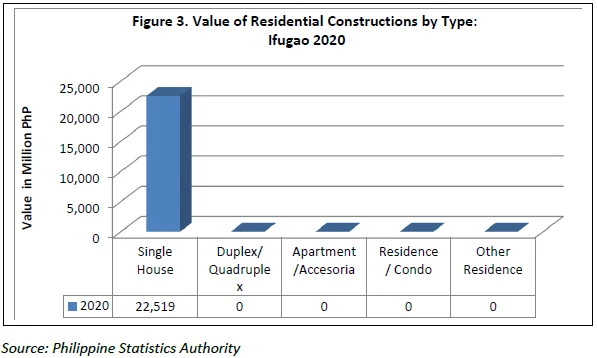
The total value of constructions in 2020 estimated to PhP 107.5 million, which was declined by 37.6 percent from PhP 172.4 million in 2019. Residential building constructions, valued at PhP 22.5 million which was accounted for 20.9 percent of all the total types of building constructed. This number displayed 9.0 percent lower from the PhP 24.7 million valued of residential constructions reported in 2019.
Non-residential building constructions recorded an amount of PhP 85 million or 79.1 percent of the total collected value. This amount conveyed 42.2 percent lower compared from the PhP 147 million valued of constructions in 2019.
Addition to existing structures contributed Php 0.00 in 2020 with downturns in the value of 100 percent compared with the previous year. And alteration and repair recorded nothing for both years, (See Table 1).
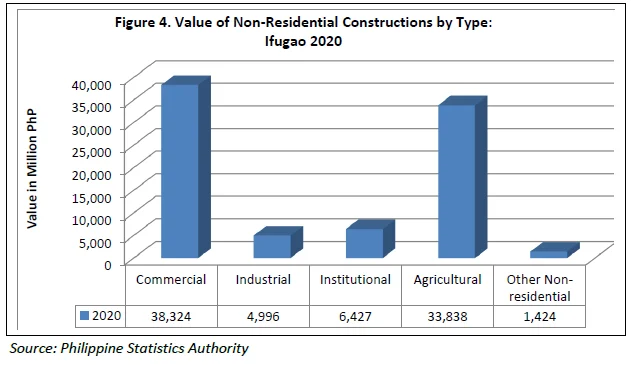
In terms of the derived gross value per type of constructions, Commercial type posted the highest gross value of PhP 38.3 million or 45.1 percent of the gross total value. Followed by Agricultural type of constructions with a gross value of PhP 33.8 million or 39.8 percent share of the gross total, and Institutional type recorded PhP 6.4 million or 7.6 percent share of the total gross value.
Average cost per square meter of residential constructions decrease by 20 percent
The total value of residential constructions in 2020 which Single Houses represents was estimated at PhP 22.5 million with a total floor area of 2,804 square meters, which translates to an average cost PHP 8,031 per square meter. This figure is 20.3 percent lower than the average cost of PHP 10,074 per square meter recorded in 2019, (See Table 1 & Figure 5).
Non-residential constructions average cost per square meter decrease by 35 percent
Non-residential constructions posted an average cost of PhP 5,085 per square meter in 2020. A decreased of 35.2 percent compared in 2019 with an average cost of PhP 7,852 per square meter. Addition to existing structures showed a down trend as recorded nothing in 2020 while Alteration and repair remain blank as illustrated in table 1.
Figure 5. Average Cost per Square Meter by Type of Constructions,
Ifugao 2020

