Number of constructions from approved building permits increases
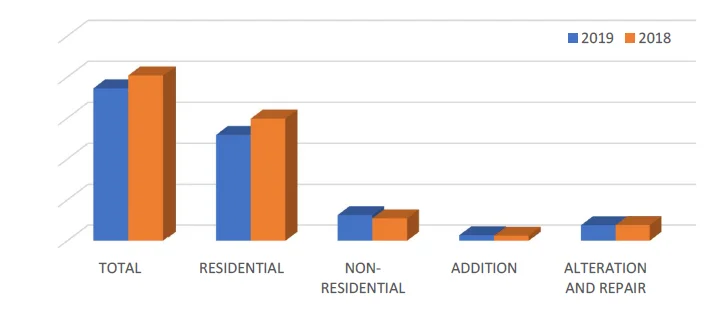
- The total number of constructions from approved building permits in the fourth quarter of 2019 reached 37,265. This reflects a decrease of 7.7 percent from the 40,369 constructions recorded during the same quarter in 2018.
Table 1. Construction Statistics, Philippines: Fourth Quarter, 2018 and 2019
| Type of Construction | Fourth Quarter 2018 | Fourth Quarter 2019 |
|---|---|---|
| Residential | ||
| Number | 29,845 | 25,869 |
| Floor Area (sq.m.) | 5,423,990 | 4,391,454 |
| Value (PHP '000) | 57,511,957 | 52,163,861 |
| Non-residential | ||
| Number | 5,491 | 6,289 |
| Floor Area (sq.m.) | 4,860,131 | 4,507,894 |
| Value (PHP '000) | 53,379,972 | 52,330,073 |
| Addition | ||
| Number | 1,226 | 1,337 |
| Floor Area (sq.m.) | 161,806 | 143,556 |
| Value (PHP '000) | 1,451,462 | 1,262,381 |
| Alteration and Repair | ||
| Number | 3,807 | 3,761 |
| Value (PHP '000) | 10,060,930 | 5,827,882 |
| Total | ||
| Number | 40,369 | 37,265 |
| Floor Area (sq.m.) | 10,445,927 | 9,042,904 |
| Value (PHP '000) | 122,404,322 | 111,584,196 |
Note: Details may not add up to total due to rounding.
Source: Philippine Statistics Authority
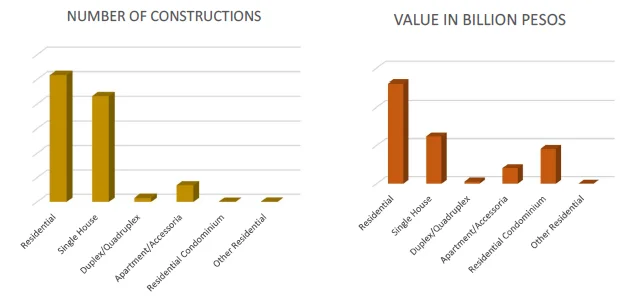
- Of the types of construction, residential building was the highest with 25,869 permits or 69.4 percent of the total building permits. Compared with the fourth quarter of previous year, the number of residential constructions was 13.3 percent lower during the fourth quarter of 2019. All types of residential constructions, except other residential and duplex/quadruplex, recorded decreases: residential condominiums (42.2%), apartment/accessoria (13.6%) and single-type houses (14.5%).
-
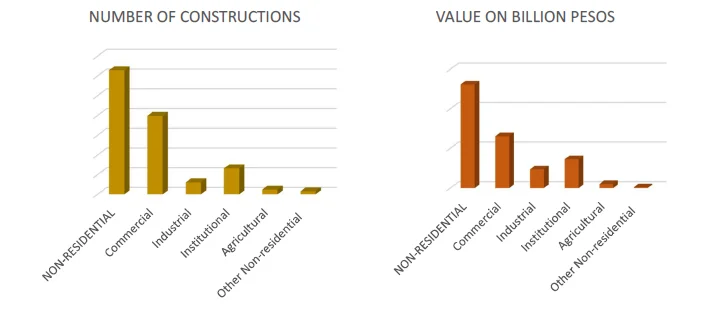
Meanwhile, the number of non-residential constructions that accounted for 6,289 or 16.9 percent of the total, posted 14.5 percent increase from the 5,491 constructions recorded during the same period of previous year. The growth was brought about by the increases in the number of the following types of building: commercial with 3,982 (63.3%); agricultural, 234 (7.3%); and institutional, 1,316 (3.9%).
-
Number of additions to existing structures were 1,337 (3.6%), increased by 9.1 percent from the 1,226 recorded during the same period of 2018. On the other hand, combined number of alterations and repairs of existing structures at 3,761 (10.1%), decreased by 1.2 percent from the 3,807 recorded during the same period of previous year.
Figure 1. Number of Constructions from Approved Building Permits by
Type, CAR: Fourth Quarter, 2019 and 2018
CALABARZON shares more than a fifth of national constructions
- During the quarter, the top five regions in terms of number of constructions, collectively comprised 66.0 percent of the total. CALABARZON continued to account for the biggest share with 9,808 constructions or 26.3 percent of the total. Central Visayas with 4,880 constructions or a share of 13.1 percent to total, ranked second. Other regions in the top five were: Central Luzon with 3,677 (9.9%) constructions; Ilocos Region with 3,335 (9.0%) constructions; and, National Capital Region (NCR) with 3,114 (7.7%) constructions.
Figure 2. Distribution of Constructions from Approved Building Permits by
Region, Philippines: Fourth Quarter of 2019.

- The top 10 provinces accounted for 48.9 percent of the total. Cavite remained highest with 4,382 constructions or a share of 11.8 percent to the national. Cebu and Laguna with 2,025 (5.4%) and 1,973 (5.3%) constructions ranked second and third,respectively. Completing the list of top 10 provinces with the greatest number of constructions were:
- Batangas with 1,953 (5.2%)
- Bohol with 1,615 (4.3%)
- Fourth District of NCR with 1,461 (3.9%)
- Bulacan with 1,317 (3.5%)
- Pangasinan with 1,265 (3.4%)
- Negros Oriental with 1,158 (3.1%)
- Davao Del Sur with 1,084 (2.9%)
- Relative to the same period of previous year, constructions in Cavite at 4,382 went down by 22.8 percent, the highest among the provinces in terms of number.
Total value of constructions posts 8.8% decrease
- Total value of constructions during the fourth quarter of 2019 was PHP111.6 billion, down by 8.8 percent from the PHP122.4 billion recorded in the fourth quarter of 2018.
- Residential constructions comprising 46.7 percent of the national was valued at PHP52.2 billion, the highest among the types of construction. The value of construction decreased by 9.3 percent from the previous year’s PHP57.5 billion. This was attributed to the decreases in the construction values of residential condominiums (23.0%) and apartment/accessoria (13.6%)
- Total value of non-residential constructions accounting for 46.9 percent was valued at PHP52.3 billion. It was lower by 2.0 percent compared to the PHP53.3 billion construction value recorded during the fourth quarter the previous year. This was influenced by the decrease in the construction value of new commercial buildings (16.5%).
- Similarly, construction values of addition to existing structures, amounting to PHP1.3 billion, decreased by 13.0 percent from the PHP1.5 billion recorded during the same period of 2018. Combined construction values of alteration and repair of existing structures, estimated at PHP5.8 billion, also went down by 42.1 percent from the PHP10.1 billion registered in the same quarter of 2018.
Figure 3. Value of Constructions from Approved Building Permits by Type,
Philippines: Fourth Quarter, 2019 and 2018

- In terms of value of construction, the combined share of the top five regions amounting to PHP83.0 billion comprised 74.3 percent of the total. NCR, which ranked fifth in the number of constructions was the highest in terms of value, with PHP32.2 billion or more than one-fourth (28.8%) of the total. Other regions in the top five were:
- CALABARZON, PHP19.4billion (17.4%)
- Central Visayas, PHP12.0 billion (10.7%)
- Central Luzon, PHP11.4 billion (10.2%)
- Western Visayas, PHP8.0 billion (7.2%)
Average cost per square meter of residential-type construction increases by 12.0%
- The average cost per square meter of residential constructions in the fourth quarter of 2019 was estimated at PHP11,878, an increase of 12.0 percent compared with the same quarter of previous year’s average cost of PHP10,603. The overall increase was propped by the increases in the average cost per square meter of residential condominiums (54.9%), duplex/quadruplex (20.4%), and other residential construction (17.6%).
- Single-type houses with 21,591 constructions or a share of 83.5 percent to the total, dominated all other types of residential constructions. This type of construction was valued at PHP24.7 billion, with a total area of 2.5 million square meters or an average cost of PHP10,024 per square meter.
- Apartment/accessoria-type units came next with 3,387 constructions or 13.1 percent of the total. This type of construction, valued at PHP8.1 billion, had a total floor area of 893.6 thousand square meters or an average cost of PHP9,041 per square meter.
- Duplex/quadruplex-type dwellings, with 810 constructions or 3.1 percent of the total, ranked third. Total construction value for this type of construction was estimated at PHP1.1 billion, with a total floor area of 87.6 thousand square meters or an average cost of PHP12,110 per square meter.
-
Residential condominiums followed with 37 constructions or 0.1 percent of the total. It was valued at PHP18.3 billion, with a total floor area of 941.8 thousand square meters or an average cost of PHP19,391 per square meter.
Figure 4. Number and Value of Residential Constructions from Approved
Building Permits by Type, Philippines: Fourth Quarter, 2019
Average cost per square meter of non-residential constructions is higher by 5.7%
- The average cost per square meter of non-residential constructions was recorded at PHP11,609. This was 5.7 percent higher than the PHP10,983 recorded during the same period of 2018. The incline was attributed to the increases in the average cost per square meter of industrial (30.7%), agricultural (6.5%) and institutional (5.4%) buildings. On the other hand, a decrease of 1.6 percent in the average cost per square meter was noted for commercial.
- Among the non-residential constructions, commercial-type buildings posted the highest number with 3,982 or 63.3 percent of the total. Construction value for this type was estimated at PHP26.1 billion, with a total floor area of 2.2 million square meters or an average cost of PHP11,780 per square meter.
- Institutional-type buildings with 1,316 constructions or 20.9 percent of the total, ranked second. Total value of construction for this type, which amounted to PHP14.5 billion, had a total floor area of 943.6 thousand square meters or an average cost of PHP15,365 per square meter.
- Industrial-type buildings came third, with 608 constructions or 9.7 percent of the total. Total construction value for this type was estimated at PHP9.4 billion, with a total floor area of 1.0 million square meters or an average cost of PHP9,760 per square meter.
- Agricultural-type buildings recorded a total of 234 constructions or 3.7 percent of the total. Total construction value for this type was PHP1.9 billion, with a total floor area of 380.5 thousand square meters or an average cost of PHP5,055 per square meter.
Figure 5. Number and Value of Non-residential Constructions from Approved
Building Permits by Type, Philippines: Fourth Quarter, 2019